- The S&P 500 soared to record highs, with the index hitting the historic 5000-point milestone first time.
- This feat showcases a sustained rally that has doubled since the pandemic low in March 2020
- In this piece, we will examine some factors that suggest that the market rally could continue in 2024.
- If you invest in the stock market, get an interesting discount HERE! Find more information at the end of this article.
On Friday, the S&P 500 and Nasdaq 100 reached new all-time highs, with the S&P 500 hitting 5000 points and heading for a fifth consecutive week of gains, doubling since its pandemic low in March 2020.
It took 719 sessions for the index to rise by 1,000 points, achieving this feat for the 13th time since its inception in 1957, with a remarkable 14 out of the last 15 weeks showing gains, a trend not seen since 1972.
This remarkable rally, which began last year, can be attributed to several factors:
- Strong Earnings: Approximately two-thirds into the earnings season, companies are surpassing expectations, with around 80% of S&P 500 companies exceeding estimates, surpassing the 10-year average of 74%.
- Expected Fed Rate Cuts: Federal Reserve members have signaled intentions to cut interest rates this year, some specifying up to three times.
- Dominance of Key Stocks: The same small group of stocks responsible for most of the gains in 2023 continues to rise.
- Geopolitical Stability: None of the ongoing geopolitical conflicts have escalated further.
Can the Stock Market Rally Continue? This Key Ratio Says Yes
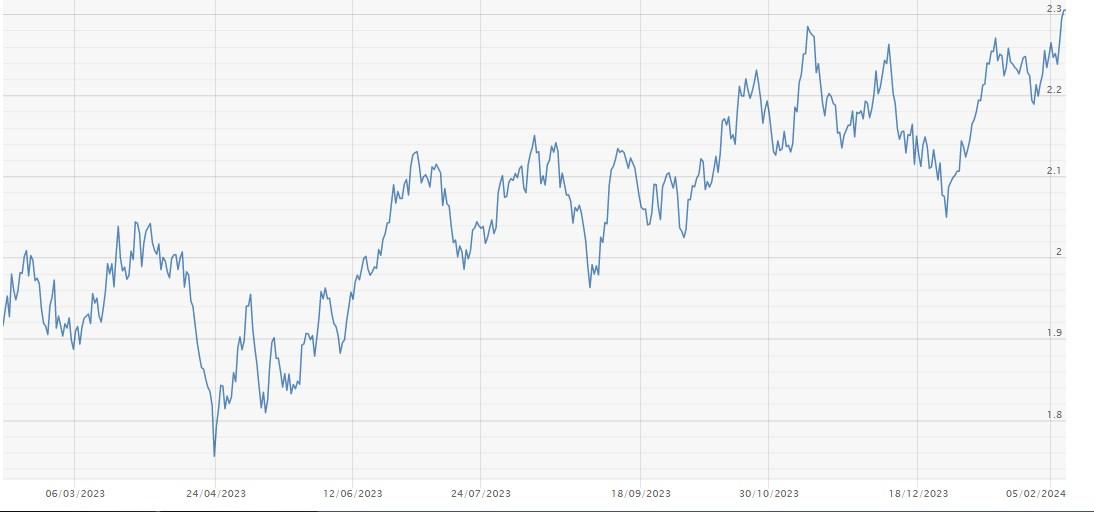
The gold/platinum ratio indicates the number of ounces of gold that can be acquired with one ounce of platinum.
A rising ratio is considered favorable for the stock market, suggesting positive industrial demand and market participants' interest in hedging against uncertainties.
As depicted in the chart, the ratio has been in an uptrend over the last 12 months, supporting the positive trend in the US stock market.

Source: BullionByPost
Furthermore, February tends to favor certain stocks historically. Over the past five Februarys, several companies outperformed the market:
- Nvidia (NASDAQ:NVDA): +9.1%
- United Rentals (NYSE:URI): +6.8%
- Monolithic Power Systems (NASDAQ:MPWR): +6.3%
- Old Dominion Freight Line (NASDAQ:ODFL): +5.2%
- Cadence Design Systems (NASDAQ:CDNS): +4.8%
- Ulta Beauty (NASDAQ:ULTA): +4.4%
- Analog Devices (NASDAQ:ADI): +3.6%
- Eaton Corporation (NYSE:ETN): +3.3%
- CSX Corporation (NASDAQ:CSX): +1.5%
Investor sentiment (AAII)
Bullish sentiment, i.e. expectations that stock prices will rise over the next six months, remained at 49% and is at a high level and above its historical average of 37.5%.
Bearish sentiment, i.e. expectations that stock prices will fall over the next six months, declined to 22.6% and remains below its historical average of 31%.
Bitcoin Rally on the Horizon?
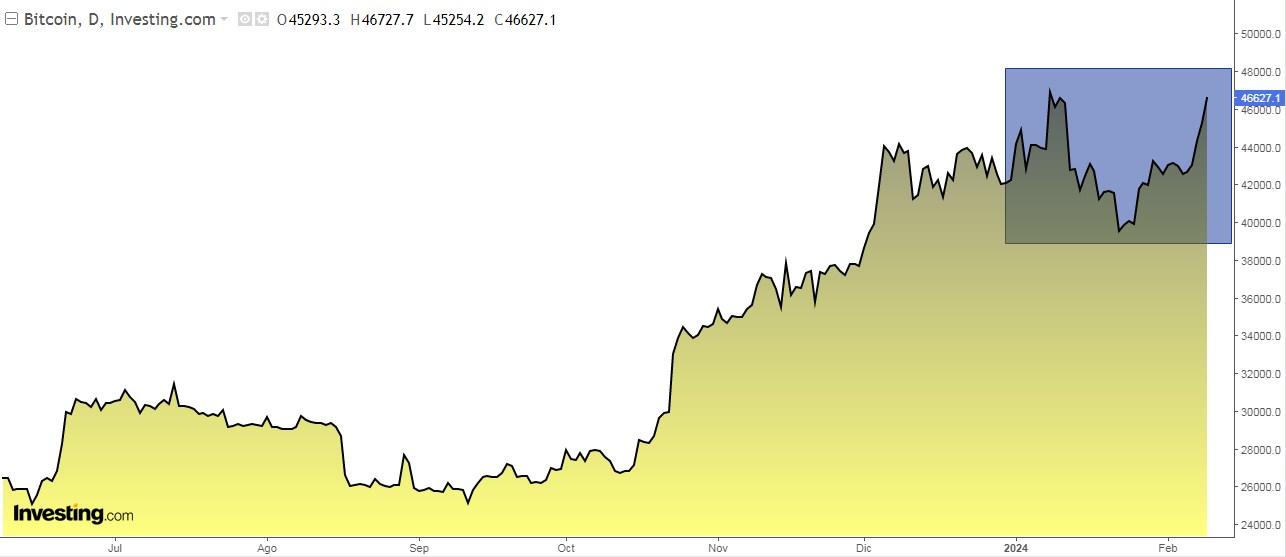
Bitcoin's response to the SEC's approval of new spot ETFs did not align with the expectations of many investors, primarily due to the anticipated demand and influx of new funds not materializing as intensely as projected.
However, there has been a notable shift in this trend, with these ETFs experiencing almost $1.7 billion in inflows. This development holds the potential to boost Bitcoin's price and increase its demand.

Adding to the current market dynamics is the upcoming halving event scheduled for this year, where the reward for mining each block will be reduced.
This mechanism aims to decrease the issuance of new Bitcoins. Typically occurring every four years, or after mining 210,000 blocks, each halving results in a 50% reduction in the creation of new Bitcoins.
Given that the total number of Bitcoins is capped at 21 million, halving serves as a crucial control on the rate of coin creation.
Historically, there have been three halvings:
- November 28, 2012
- July 9, 2016
- May 11, 2020
What adds intrigue is the subsequent price action:
- After the first halving, Bitcoin surged from $12 to nearly $1,000.
- Post the second halving, it reached $2,550.
- Following the third halving, Bitcoin's price climbed from $8,700 to $19,700 in December 2020, eventually surging to $66,000.
The fourth halving is anticipated to take place this April, around the middle of the month.
Meanwhile, attention is also directed towards Ethereum, awaiting a potential SEC clearance for spot ETFs.
In late January, the SEC deferred its decision on Grayscale Investments' application to convert its Ethereum fund into a spot ETF, similar to the process undertaken with Bitcoin.
Has the Time Come for China’s Stock Market?
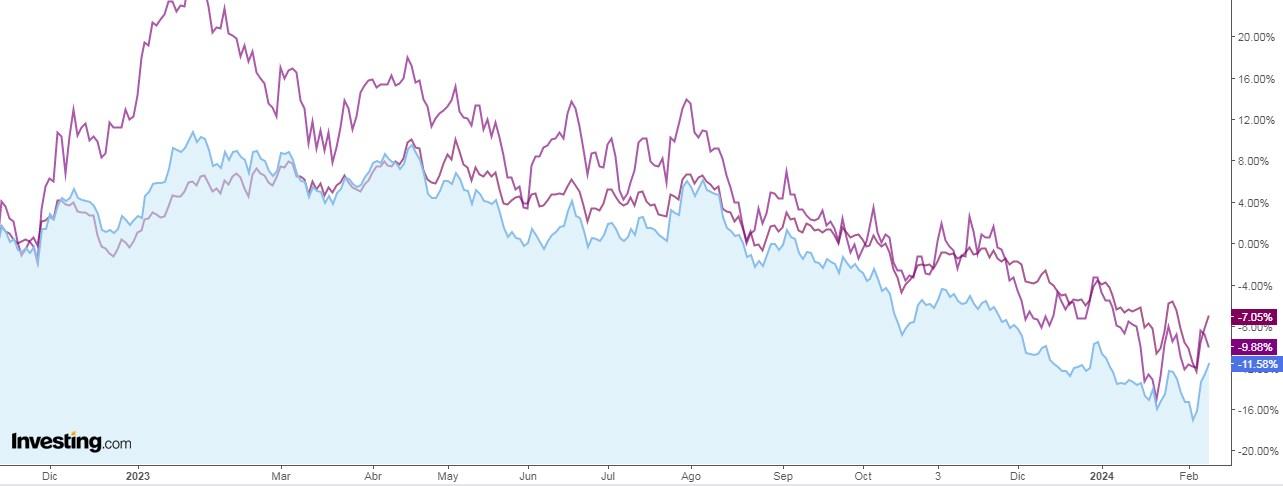
Last Saturday, February 10 was the Lunar New Year or Chinese New Year and marked the beginning of the year of the dragon. Traditionally, the dragon has been a symbol of good luck, strength, and health.
The Chinese stock markets need all of that right now. Just look at the performance of the Shanghai Composite, the Hong Kong Hang Seng and the CSI 300. The real estate crisis and a slowing economy are the reasons behind it.

Some signs of a possible turnaround have begun to materialize following the encouragement measures introduced by the Beijing authorities, such as restrictions on bearish traders and incentives for share buybacks.
Not only that, Central Huijin Investment, a sovereign wealth fund that owns China's state-owned banks and other large government-controlled companies, promised to expand its stock buybacks to help the markets.
Also, did you know how the S&P 500 tends to perform during the Year of the Dragon?
- Year 1952: +9.3%.
- Year 1964: +13.7%.
- Year 1976: +1.2%.
- Year 1988: +15.7%.
- Year 2000: -2%.
- Year 2012: +14.1%.
- Year 2024:?
Not a bad record, right? Let's see if the party continues in 2024.
Global Stock Indexes Rankings YTD
- Nikkei +10.26%
- Nasdaq +6.52%
- S&P 500 +5.38%
- Euro Stoxx 50 +4.30%
- FTSE MIB Italian +2.65%
- Dow Jones +2.61%
- Cac francés +1.38%
- Dax alemán +1.04%
- Ibex 35 Spanish -2.03%
- FTSE 100 UK -2.08%
***
Do you invest in the stock market? Set up your most profitable portfolio HERE with InvestingPro!
Apply discount code INVESTINGPRO1 and you'll get an instant 10% discount when you subscribe to the Pro or Pro+ annual or biennial plan. Along with it, you will get:
- ProPicks: AI-managed portfolios of stocks with proven performance.
- ProTips: digestible information to simplify a lot of complex financial data into a few words.
- Advanced Stock Finder: Search for the best stocks based on your expectations, taking into account hundreds of financial metrics.
- Historical financial data for thousands of stocks: So that fundamental analysis professionals can delve into all the details themselves.
- And many other services, not to mention those we plan to add in the near future.
Act fast and join the investment revolution - get your offer HERE!
Disclaimer:The author does not own any of these shares. This content, which is prepared for purely educational purposes, cannot be considered as investment advice.

