- It has been many years since investors had such an affordable option to safeguard themselves against a market downturn.
- However, there are several factors indicating a continued market uptrend.
- Ready to capitalize on market opportunities? Act now and explore InvestingPro! Sign up HERE & NOW for less than $9 per month and enjoy almost 40% off for a limited time on your 1-year plan!
Hedging against a market downturn is currently proving to be remarkably inexpensive, and I'll explain you why.
The VVIX concluded last week at its lowest closing value since May 2015, significantly below its one-year average of 89. This decline indicates that investors are refraining from investing in VIX call options.
You could describe the VVIX as the volatility index of the VIX, which effectively measures the 30-day volatility of the VIX rather than the S&P500. The VVIX typically fluctuates between 60 and 140 points, with an average around 86 points.
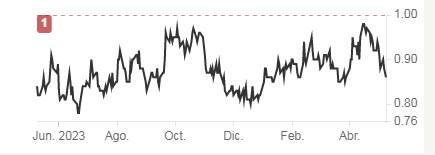
Regarding the VIX/VXV ratio, it's noteworthy that the VIX represents implied volatility at 1 month while the VXV reflects implied volatility at 3 months. Generally, the VIX tends to be lower than the VXV due to the increased uncertainty over a longer time horizon.
There are two key observations regarding this ratio:
- A ratio greater than 1 suggests heightened uncertainty, which usually bodes negatively for the stock market.
- A ratio below 1 indicates a sense of calm, which is often favorable for the stock market.
Historically, when the ratio hovers around 0.82, the S&P500 has predominantly experienced bullish trends. Currently, the ratio stands at 0.86.

But should you, in fact, hedge against market volatility at this point? Let's take a look at a couple of factors that will help us understand the market's current state of affairs ahead of a remarkably busy week.
2 Things That Could Encourage Investors

There are two compelling factors that should provide encouragement to investors at this point:
1. The S&P 500 demonstrated remarkable growth in the first quarter, surging by over +10% and following a similar trend from the previous quarter. Consecutive quarters of such substantial growth, each exceeding +10%, are a rarity.
Notably, when the index experiences a first-quarter increase of over +10%, historical data indicates that the remainder of the year tends to be positive. This trend has held true in 10 out of 11 instances, with the only exception being the renowned year of 1987. On average, the subsequent months see an increase of +8.1%. Therefore, a strong performance in the first quarter typically sets the stage for a bullish remainder of the year.
2. In corporate earnings presentations, an impressive 75% have surpassed earnings forecasts, with an average beat of +8%. Projections for corporate earnings among S&P 500 members are anticipated to reach an all-time high this year, with an expected gain of close to +11%.
This robust performance in earnings serves as one of the primary drivers for the upward trajectory of equities: when companies' forecasts are ambitious and they consistently outperform them, it instills confidence and contributes to market growth.
Mother's Day and the Dow Jones

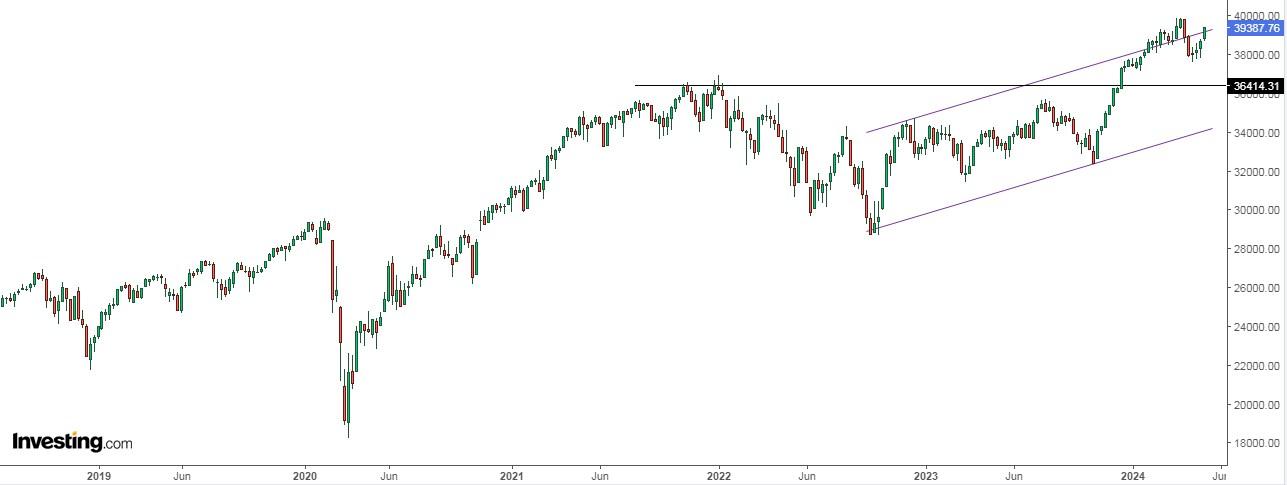
Examining the Dow Jones performance since 1994, we observe the following trends:
- On the day preceding Mother's Day (Friday), the index has risen almost 70% of the time, with an average increase of +0.25%.
- Conversely, the day following Mother's Day (Monday), it has seen an uptick 69% of the time, with an average rise of +0.23%.
While these statistics present positive indicators, it's important to remember that past performance does not guarantee future returns.
Investor Sentiment (AAII)
Bullish sentiment, i.e. expectations that stock prices will rise over the next six months, rebounded 6.4 percentage points to 38.5% and remains above its historical average of 37.5%.
Bearish sentiment, i.e. expectations that stock prices will fall over the next six months, fell 1.4 percentage points to 32.5%.
2024 Stock Market Rankings
Here's the ranking of the top-performing stock exchanges for this year:
- Nikkei: 14.24%.
- FTSE MIB: 14.19%
- Euro Stoxx 50 12,47%
- Dax: 12.07
- Ibex 35: 9.93% S&P 500
- S&P 500: 9.46%
- FTSE 100: 9.06%
- French Cac French 8.96%
- Nasdaq 8,82%
How do you continue to take advantage of market opportunities? Act NOW to grab InvestingPro's annual plan for under $9 per month. Use code INVESTINGPRO1 at checkout and enjoy 40% off your 1-year subscription - less than what a Netflix (NASDAQ:NFLX) subscription costs you! (And you get more out of your investments too). With it you will get:
- ProPicks: AI-managed portfolios of stocks with proven performance.
- ProTips: Simplified insights from complex financial data.
- Advanced Stock Finder: Identify top stocks based on your criteria and hundreds of financial metrics.
- Historical financial data for thousands of stocks: For in-depth fundamental analysis.
- And many other services, with more to come in the near future.
Don't wait - seize this opportunity and join the investment revolution today! Get your offer HERE!
