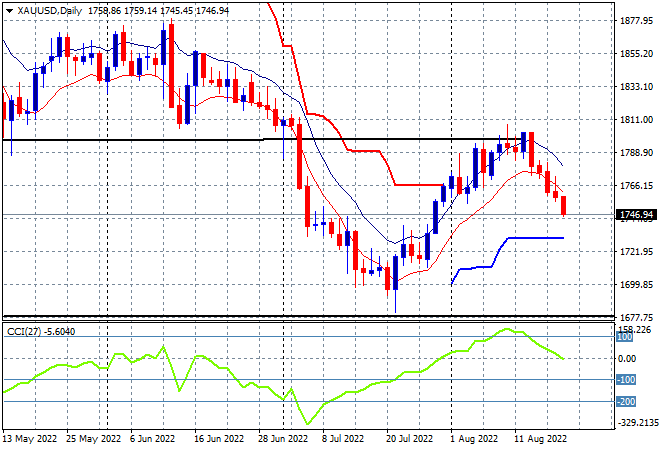
Risk markets were spooked a bit by further inflation prints and measures by the Fed that saw Wall Street lose significant ground as we head into the Jackson Hole meeting in this trading week. This spilled over into a higher USD, with Euro and Pound Sterling making new monthly lows, as the former heads to parity again. The Australian dollar didn’t fare much better, pushed below the 69 cent level as commodity prices generally fell across the board. Bond markets were equally volatile with 10 Year Treasuries almost back above the 3% level while interest rate futures suggest a 60bps rise at the next Fed meeting. Crude oil remains tenuous, with Brent crude unable to get back above the $96USD per barrel level while gold lost even more ground to finish the week at the $1745USD per ounce level, again rejecting the $1800 resistance level.
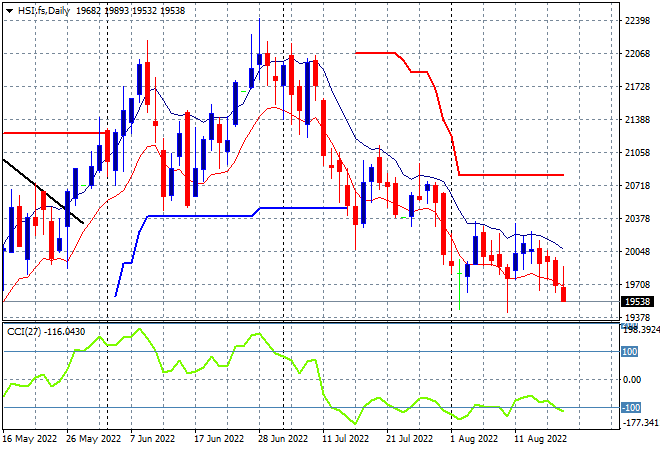
Looking at share markets in Asia from Friday’s session, where mainland Chinese share markets were unchanged until the afternoon session when the selloff commenced, with the Shanghai Composite closing down 0.6% to 3258 points while the Hang Seng Index was dead flat, capping off a poor week and finishing below the 20,000 point level. The daily chart is still showing considerable overhead resistance and daily momentum readings now pushing into oversold mode as the moving average channel accelerates lower without any upside pressure. The May lows are coming under pressure with another break below the low moving average likely:
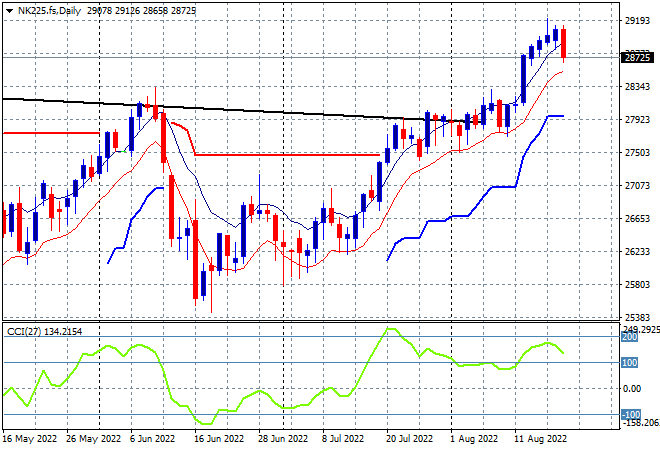
Japanese stock markets had an unsteady ride due to the CPI print with the Nikkei 225 losing just 0.1% to close at 28930 points. The daily chart was showing a nice breakout here after finally clearing resistance at the previous highs at 28000 points and daily momentum remaining well overbought, but as I mentioned in Friday’s report, the recent daily candle is technically a one-day bearish reversal pattern with futures suggesting a big drop this morning. The overall monthly/weekly downtrend (sloping black line above) seems to be broken here after price action bunched up for so long so with very positive risk sentiment now, but the 29000 point level is turning into resistance:
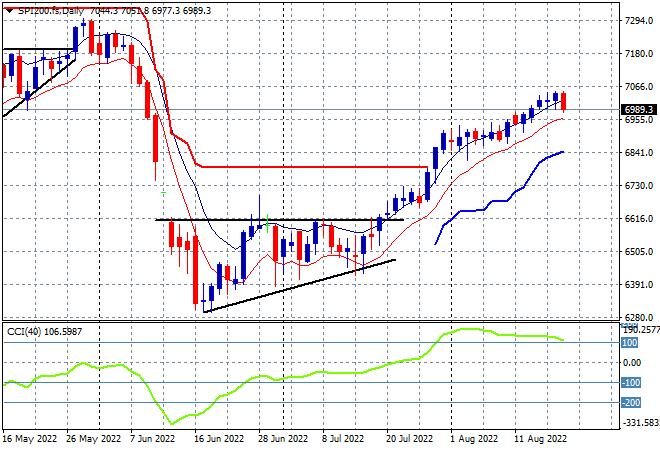
Australian stocks were also in scratch session territory on Friday with the ASX200 closing 1 point higher at 7114 points. SPI futures are down at least 0.4% due to the selloff on Wall Street and could shoot even lower on the weekend gap open as risk sentiment inverts. The daily chart was looking firm here with the short term breakout situation converting into something more sustainable with resistance not evident. However daily momentum is inverting back below overbought levels but if it can hold on to the 7000 point level, and the lower AUD continues, support should build:
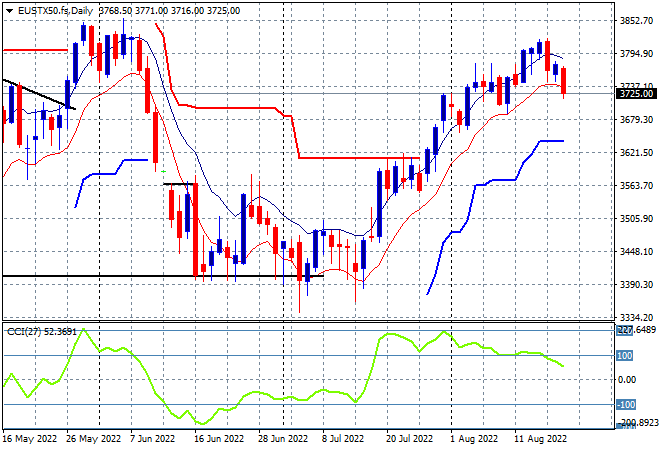
European stocks were generally down with only the FTSE putting on meagre positive gains, while peripheral bourses and central markets alike fell back around 1%, the Eurostoxx 50 index reflecting this with a 1.2% drop to close at 3730 points. The daily chart shows price action hitting a wall after moving sharply higher through overhead resistance a few weeks back, with previously overbought daily momentum now reverting as stiff resistance mounts at the 3800 point level. Friday’s efforts show that the May highs at the 3850 point level may be out of reach:
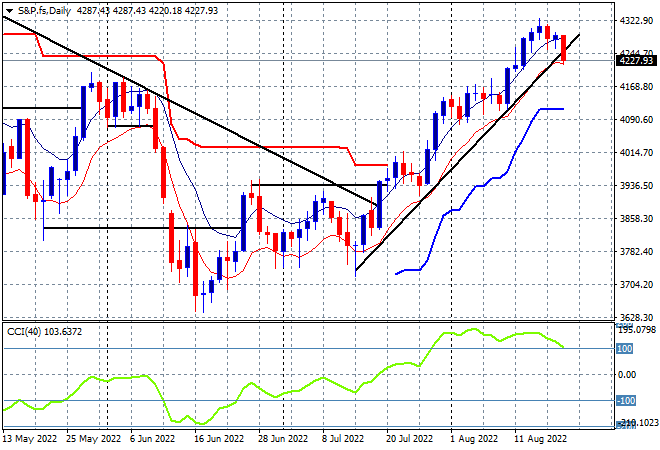
Wall Street however had an even worse result with the NASDAQ finishing 2% lower while the S&P500 eventually finished 1.3% lower at 4228 points. The daily chart shows the potential trendline having broken here although daily momentum remains slightly overbought and price action remains above the previous May highs. The area to watch this week is the low moving average at the 4200 point level which must hold or a dip down to the 4170 or perhaps trailing ATR daily support will eventuate:
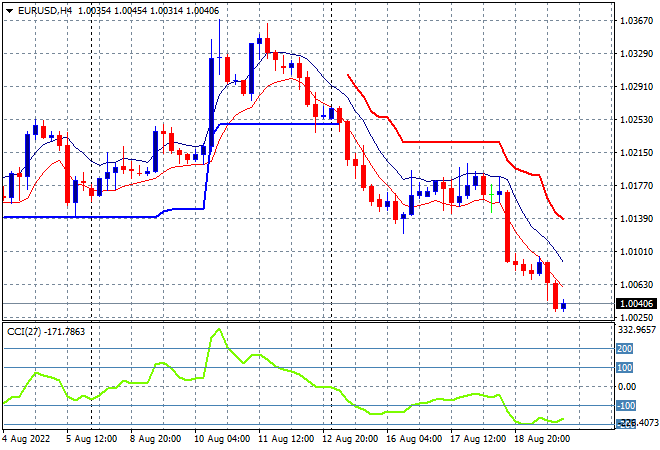
Currency markets continue to see strengthening in USD, with the US Dollar Index up another 0.6% to another new high on Friday night. This was mainly because of Euro, but also Pound Sterling, with the former now dicing yet again with parity. Momentum on the four hourly chart has returned to oversold readings with price action nowhere near the low moving average let alone the high – you’d be a buyer if you turned this chart upside. I’m still looking here for a potential sharp reversal but that is low probability if the parity 1.00 level is broken in the slightest:
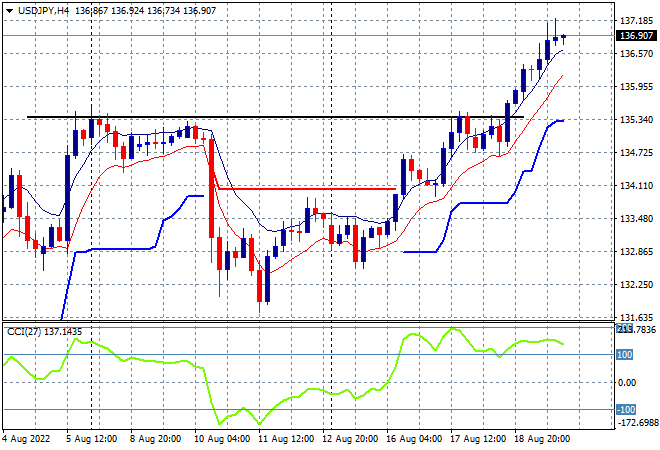
The USDJPY pair continued its breakout on Friday night above short term resistance at the 135 handle, but slowed down as it hit the 137 level with the positive candles on the four hourly chart showing clear resistance building. While this new monthly high on the back of a much stronger USD could solidify from here with very strong internal buying support, I’m wary of a potential sharp swing back down to the previous weekly highs so watch for any break below the low moving average at the 136 level as momentum inverts from its current overbought status:
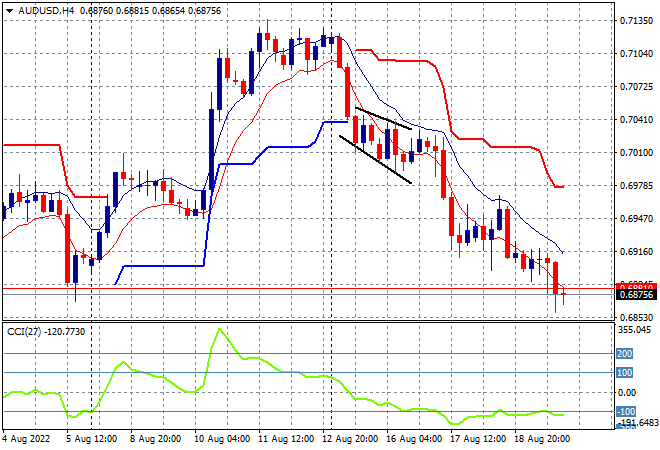
The Australian dollar was slammed lower and finishes the week below the 69 handle, a smidge below its last visit to these levels in early August. It looks like nothing can save the Pacific Peso now with the Fed hellbent on raising rates faster than local economist gurus can change their tune domestically. Price action has never threatened the high moving average and remained below former trailing ATR support with four hourly momentum picking up on the negative side:
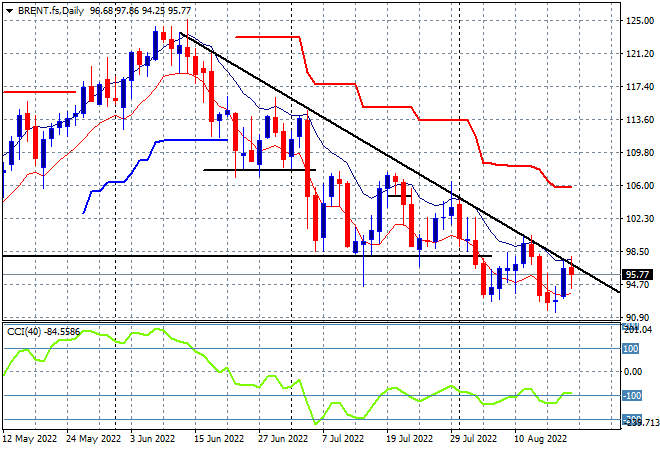
Oil markets are failing in their comeback to defeat their deflationary trend with Brent crude finishing below the key $100USD per barrel level yet again, closing at just below the $96USD per barrel level on Friday night. Price action is almost below the pre-Russian invasion February lows and still below the downtrend line from the June highs. There is no breakout evident yet as daily momentum has been unable to get out of its very negative funk. The real level to beat remains $100 which is turning into very strong resistance here:
Gold continues to slump on the higher move in USD with the $1750USD per ounce level taken out on Friday night, confirming the move below the previous weekly low at the $1763 level for another new daily low. The daily chart shows this reversal accelerating with daily momentum now neutral at best with the next level of support not that far away as this relief rally takes back half of its gains from the $1700 bottom: