Friday night saw the release of the latest US non-farm payroll aka monthly unemployment print, which came in slightly stronger than expected and keeps the foot on the Federal Reserve’s rate rise accelerator. This spooked stock markets somewhat with Wall Street falling, putting in a new weekly low in the process, so expect hesitation to dominate as the trading week reopens here in Asia. Commodity prices were again the most bullish with oil prices putting in new weekly highs as Brent broke through the $120USD per barrel level while copper zoomed 5% higher although gold inverted to finish the week right on the $1850USD per ounce level.
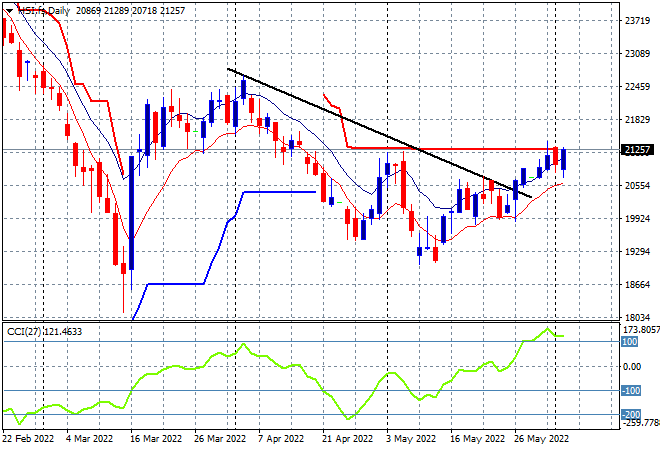
Looking at share markets in Asia from Friday’s session, where mainland and offshore Chinese share markets were closed due to a trading holiday. The Shanghai Composite closed the week out just below the 3200 point level while the Hang Seng Index was unable to hold on to its recent gains, finishing just above the 21000 point level. The daily chart is showing price wanting to get back above trailing daily ATR resistance at the 21000 point level but so far, failing to turn this into a sustainable trend. Daily momentum is still overbought but not translating into greater highs:
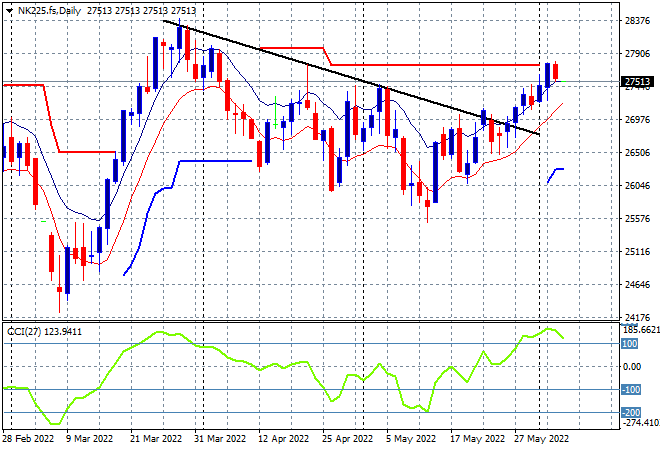
Japanese stock markets were able to lift higher on the back of a weak Yen, with the Nikkei 225 index closing 1.2% higher at 27747 points. The daily chart of the Nikkei 225 shows a good attempt to get back above the previous daily/weekly highs near the 27500 point level underway, helped by a very weak Yen. To properly reverse the downward trend from the March highs requires a substantial move above the 27000 point level with futures indicating a slight reversal to start the new trading week:
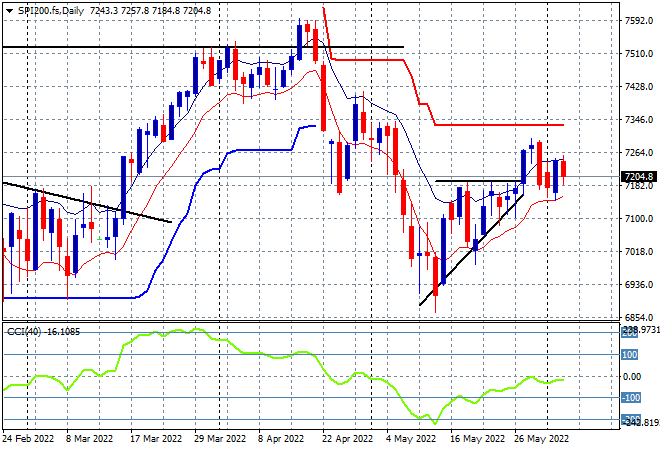
Australian stocks had a good run with the ASX200 taking back its previous session losses to close 0.8% higher at 7238 points. SPI futures are indicating at least a 0.5% drop on the open of the new trading week. The daily chart was showing a clear breakout here last week with resistance at the 7200 point level seemingly cleared very quickly, but the bearish engulfing candle combined with sustained daily negative momentum readings and choppy price action continue to suggest a false flag. Price action remains contained within the moving average band, so any actions required a substantial move either side of the band:
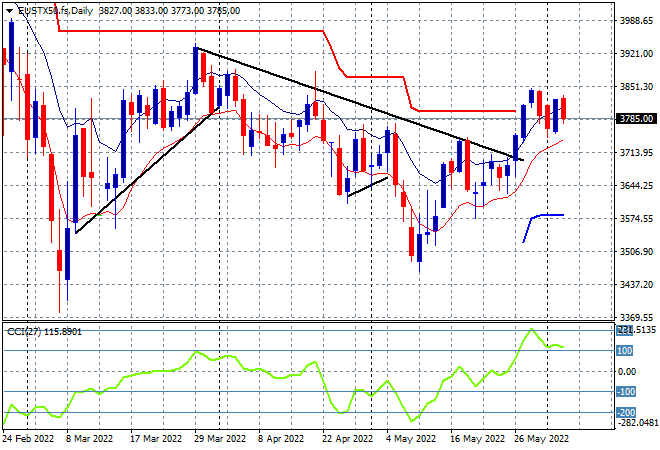
European stocks had mild retreats across the continent with the FTSE having a bank holiday while the Eurostoxx 50 index finished 0.3% lower at 3780 points. The daily chart picture is similarly showing a failed breakout that has stalled above the trailing ATR resistance level that had been keeping this market contained since the Ukrainian invasion. A similar picture to the ASX200 with support firming here at the low moving average, but I remain cautious even though daily momentum remains slightly overbought:
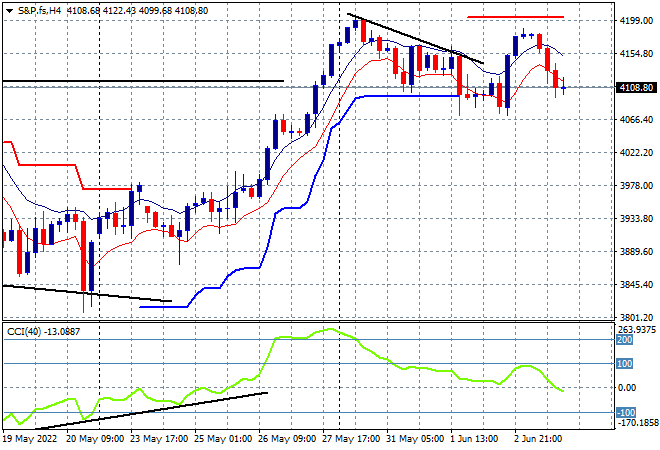
Wall Street hated the latest NFP employment prints with yet another reversal, the NASDAQ leading the way by losing nearly 2.5% while the S&P500 took back its previous sessions gains to finish more than 1.6% lower to be right back to the 4100 point level, finishing at 4108 points. The four hourly chart shows clearly how firm resistance is at the 4200 point level, now failing twice to push through as four hourly momentum indicated the lack of buying pressure. For now, support is holding at the prior resistance level at 4100 points but there’s daylight below from here if confidence evaporates:
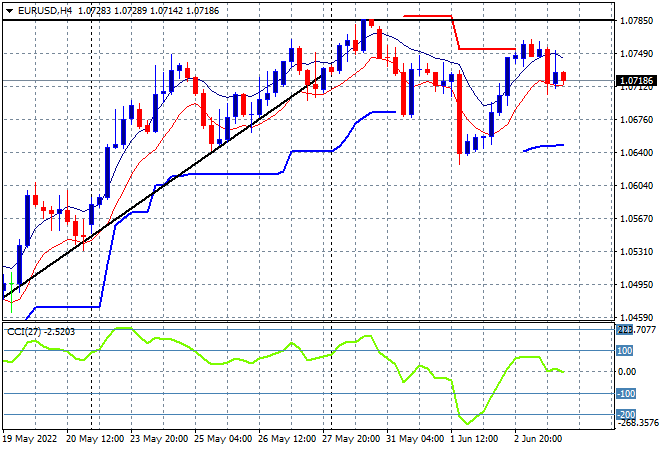
Currency markets reacted in various ways to the NFP print on Friday night with USD still maintaining an overall defensive mode although it did strengthen appreciably against Yen and the commodity currencies in particular. With Euro, the ECB hawks are still pushing their weight around with Euro retracing back to the 1.07 handle and unable to better its start of week position. Price action remains contained by resistance at the 2020 lows (upper horizontal black line), combined with four hourly momentum that refuses to strengthen beyond a modest neutral/positive setting, so watch for a potential rollover as we start the new trading week:
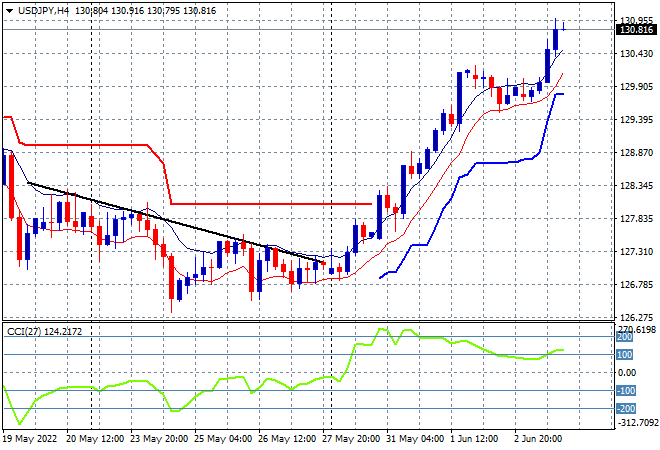
The USDJPY pair zoomed higher after a brief mid week consolidation, breaking through the 130 level in yet another big surge following the start of week breakout. Short term momentum had retraced from highly overbought levels during the consolidation but tight price action was a signal that a violent blowout or breakout was imminent and here we are. This is technically overdone and should result in a minor retracement at the start of the trading week but Yen sometimes surprises with more potentiality, so watch out:
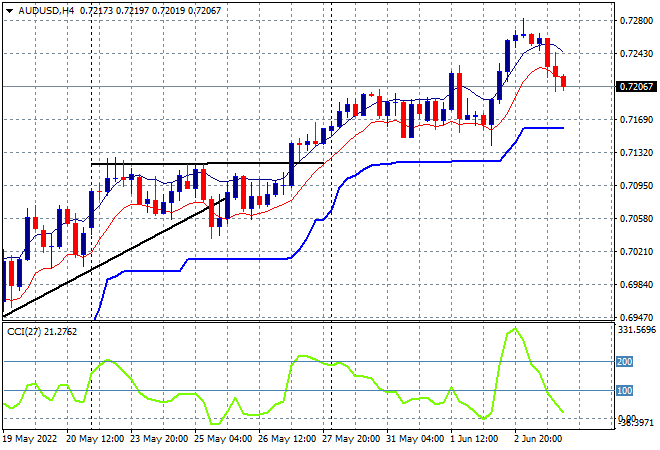
The Australian dollar however could not gain any further momentum with a sad little tombstone candle on the four hourly charts before the NFP print setting in the tone for the rest of Friday nights session. Its still a new weekly high and price did hold above the 72 handle after a false attempt earlier in the week, so that’s good news for the Aussie bulls. Four hourly momentum has retraced back from its extremely overbought levels to more neutral setting. The previous resistance level at 71 cents (upper black horizontal line from last week) has proven solid support going forward, so watch there for when the RBA meets on Tuesday with another expected rate rise to rattle the risk:
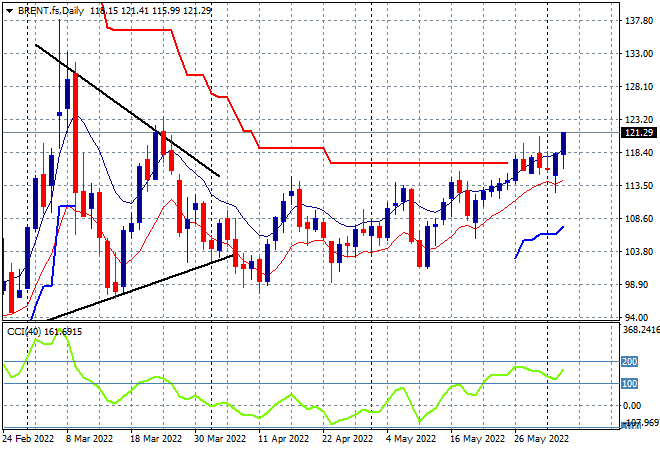
Oil markets made a big push higher on Friday night and got a lot of traction throughout the session this time with Brent pushing up through the $120USD per barrel level for a new monthly high. This takes price back to the mid March Ukrainian high volatility period and maybe setting in a new dominant trend. Daily momentum is nicely overbought and price has been supported at the $115 area so this could add up to more upside and a return to the $140 level:
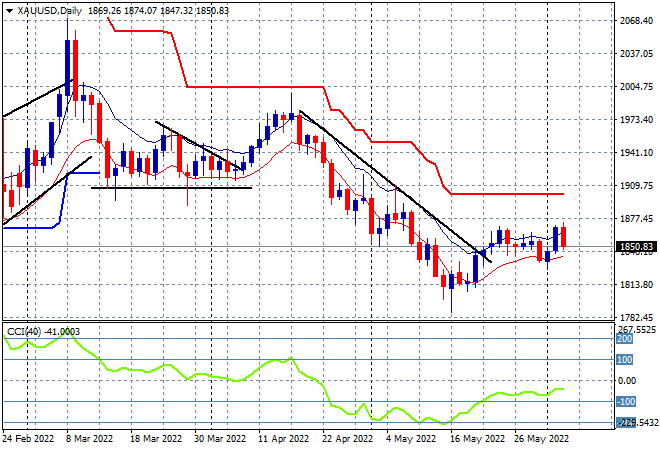
Gold however can’t find any buying support, again returning to the wobbly $1850USD per ounce level, after looking to and failing to make a new weekly high at the $1869 level in previous sessions. I’ve been pointing to the lack of a new daily high for sometime now, as a sign that this bounce from the January lows around the $1800 level was not sustainable. The lack of positive daily momentum keeps this is a low probability swing trade for now with trailing overhead ATR resistance also not under threat yet: