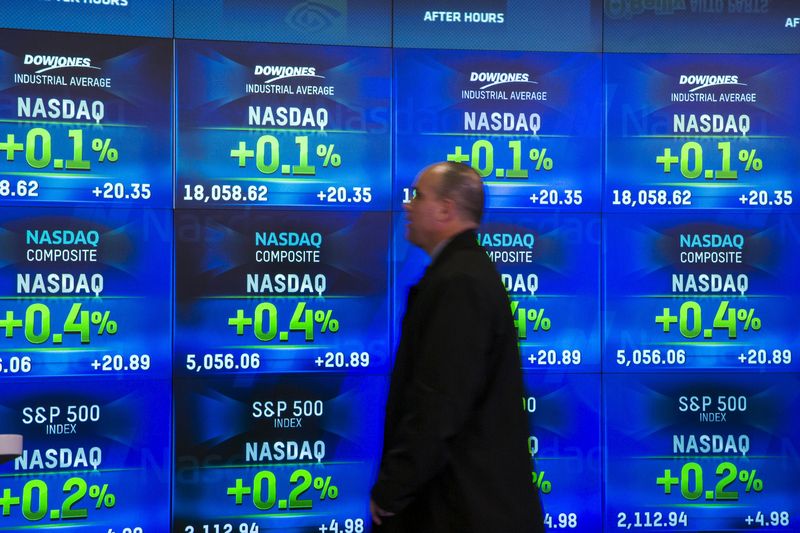
Investing.com – U.S. equities were mixed at the close on Monday, as gains in the Utilities, Telecoms and Consumer Goods sectors propelled shares higher while losses in the Oil & Gas, Industrials and Basic Materials sectors led shares lower.
At the close in NYSE, the Dow Jones Industrial Average declined 0.40%, while the S&P 500 index climbed 0.03%, and the NASDAQ Composite index added 0.22%.
The biggest gainers of the session on the Dow Jones Industrial Average were Apple Inc (NASDAQ:AAPL), which rose 2.25% or 3.13 points to trade at 142.20 at the close. Procter & Gamble Company (NYSE:PG) added 1.59% or 2.07 points to end at 132.07 and Verizon Communications Inc (NYSE:VZ) was up 1.43% or 0.82 points to 58.29 in late trade.
Biggest losers included American Express Company (NYSE:AXP), which lost 4.15% or 5.23 points to trade at 120.91 in late trade. Intel Corporation (NASDAQ:INTC) declined 2.77% or 1.57 points to end at 55.09 and Goldman Sachs Group Inc (NYSE:GS) shed 2.48% or 7.18 points to 282.21.
The top performers on the S&P 500 were Macerich Company (NYSE:MAC) which rose 18.81% to 16.93, Macy’s Inc (NYSE:M) which was up 10.83% to settle at 14.28 and Coty Inc (NYSE:COTY) which gained 9.64% to close at 6.94.
The worst performers were TechnipFMC PLC (NYSE:FTI) which was down 7.00% to 10.43 in late trade, Freeport-McMoran Copper & Gold Inc (NYSE:FCX) which lost 6.43% to settle at 28.53 and WestRock Co (NYSE:WRK) which was down 5.55% to 44.08 at the close.
The top performers on the NASDAQ Composite were Aemetis Inc (NASDAQ:AMTX) which rose 92.05% to 8.4500, Sphere 3D Corp (NASDAQ:ANY) which was up 55.26% to settle at 2.9500 and Orbital Energy Group Inc (NASDAQ:OEG) which gained 57.40% to close at 7.870.
The worst performers were Vinco Ventures Inc (NASDAQ:BBIG) which was down 16.84% to 4.050 in late trade, Exela Technologies Inc (NASDAQ:XELA) which lost 14.91% to settle at 0.8764 and Arcadia Biosciences Inc (NASDAQ:RKDA) which was down 14.20% to 2.96 at the close.
Declining stocks outnumbered rising ones by 1891 to 1228 and 74 ended unchanged; on the Nasdaq Stock Exchange, 1786 fell and 1312 advanced, while 57 ended unchanged on the New York Stock Exchange.
The CBOE Volatility Index, which measures the implied volatility of S&P 500 options, was up 9.36% to 23.96.
In commodities trading, Gold Futures for February delivery was down 0.17% or 3.15 to $1853.05 a troy ounce. Meanwhile, Crude oil for delivery in March rose 0.88% or 0.46 to hit $52.73 a barrel, while the April Brent oil contract rose 0.65% or 0.36 to trade at $55.61 a barrel.
EUR/USD was down 0.26% to 1.2139, while USD/JPY rose 0.01% to 103.78.
The US Dollar Index Futures was up 0.18% at 90.373.
