Amgen Inc (AMGN)

NASDAQ
Currency in USD
304.36
-10.03(-3.19%)
Real-time Data
AMGN Scorecard
Full Analysis
Has raised its dividend for 14 consecutive years
Fair Value
Day's Range
303.57314.22
52 wk Range
253.30346.85
Key Statistics
Edit
Prev. Close
314.38
Open
313.98
Day's Range
303.57-314.22
52 wk Range
253.3-346.85
Volume
1.52M
Average Volume (3m)
3.14M
1-Year Change
13.84%
Book Value / Share
10.93
Fair Value
unlockUnlock
Fair Value Upside
unlockUnlock
AMGN Scorecardpro icon
Company’s Health
pro lockUnlock
Fair Value
pro lockUnlock Price
Fair Pricepro lock
Upsidepro lock
Price Target
315.95
Upside
+3.81%
Members' Sentiments
Bearish
Bullish
ProTips
Net income is expected to grow this year
Show more

Amgen Inc Company Profile

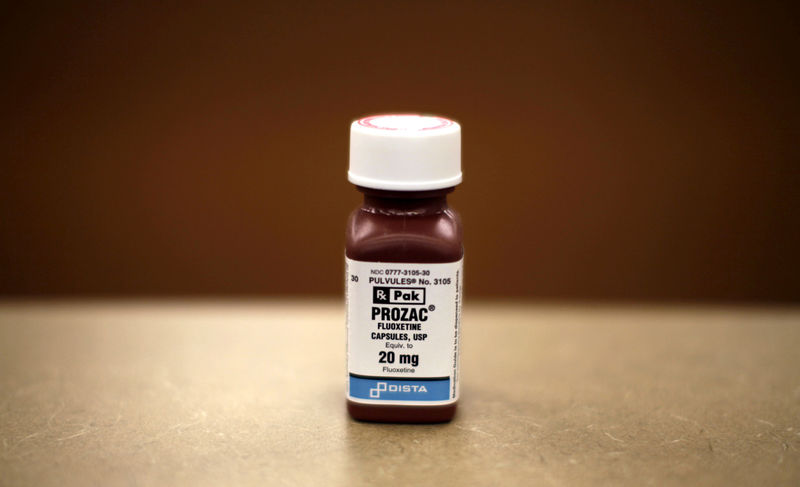
Amgen Inc. discovers, develops, manufactures, and delivers human therapeutics worldwide. The company’s principal products include Enbrel for the treatment of rheumatoid arthritis, plaque psoriasis, and psoriatic arthritis; Otezla for the treatment of adult patients with plaque psoriasis, psoriatic arthritis, and oral ulcers associated with Behçet’s disease; Prolia to treat postmenopausal women with osteoporosis; XGEVA for skeletal-related events prevention; Repatha, which reduces the risks of myocardial infarction, stroke, and coronary revascularization; Nplate for the treatment of patients with immune thrombocytopenia; KYPROLIS to treat patients with relapsed or refractory multiple myeloma; Aranesp to treat a lower-than-normal number of red blood cells and anemia; EVENITY for the treatment of osteoporosis in postmenopausal for men and women; Vectibix to treat patients with wild-type RAS metastatic colorectal cancer; BLINCYTO for the treatment of patients with acute lymphoblastic leukemia; TEPEZZA to treat thyroid eye disease; and KRYSTEXXA for the treatment of chronic refractory gout. It also markets other products, including Neulasta, MVASI, AMJEVITA/AMGEVITA, TEZSPIRE, Parsabiv, Aimovig, LUMAKRAS/LUMYKRAS, EPOGEN, KANJINTI, TAVNEOS, RAVICTI, UPLIZNA and PROCYSBI. The company serves healthcare providers, including physicians or their clinics, dialysis centers, hospitals, and pharmacies. It distributes its products through pharmaceutical wholesale distributors, as well as direct-to-consumer channels. The company has collaboration agreements with AstraZeneca plc for the development and commercialization of TEZSPIRE; Novartis Pharma AG to develop and commercialize Aimovig; UCB for the development and commercialization of EVENITY; Kyowa Kirin Co., Ltd. for rocatinlimab development and commercialization; and BeiGene, Ltd. for oncology products expansion and development. Amgen Inc. was incorporated in 1980 and is headquartered in Thousand Oaks, California.

Employees
28000

Amgen Inc SWOT Analysis


Pipeline Powerhouse
Amgen's robust pipeline, led by obesity drug MariTide, positions the company for potential market dominance and significant revenue growth
Financial Fortitude
Strong financials with $32.5B revenue and 60.6% gross margin underscore Amgen's stability amid market fluctuations and competitive pressures
Analyst Optimism
Price targets range from $310 to $405, with analysts projecting 4% CAGR from 2029 to 2033, reflecting confidence in Amgen's long-term prospects
Navigating Challenges
Amgen faces intense competition and potential clinical setbacks, but its diverse portfolio and strategic focus on R&D may mitigate risks
Read full SWOT analysis

Amgen Inc Earnings Call Summary for Q3/2024

  • Q3 revenues up 23% to $8.5B; ten products with double-digit growth in oncology and rare diseases
  • Rare disease portfolio generated $1.2B; TEPEZZA led with $488M
  • MariTide for obesity and type 2 diabetes advancing to Phase III trials
  • 2024 revenue forecast: $33.0B-$33.8B; Non-GAAP EPS expected $19.20-$20
  • Increased R&D and manufacturing investments, particularly for MariTide and late-stage pipeline
Last Updated: 01/11/2024, 03:38 am
Read Full Transcript

Compare AMGN to Peers and Sector

Metrics to compare
AMGN
Peers
Sector
Relationship
P/E Ratio
40.0x−2.4x−0.5x
PEG Ratio
−1.050.070.00
Price/Book
27.9x3.0x2.6x
Price / LTM Sales
4.9x4.6x3.0x
Upside (Analyst Target)
3.1%20.8%54.7%
Fair Value Upside
Unlock22.5%9.3%Unlock

Analyst Ratings

14 Buy
14 Hold
3 Sell
Ratings:
31 analysts
Overall Consensus
Buy

Analysts 12-Month Price Target:

Average 315.95
(+3.81% Upside)

Dividends

Payout Ratio
Payout ratio (TTM)
Earnings retained
EPS 7.62%
Dividend Yield
3.03%
Industry Median 1.78%
Annualised payout
9.52
Paid quarterly
5-Years Growth
+9.19%
Growth Streak

Earnings

Latest Release
Feb 04, 2025
EPS / Forecast
5.31 / 5.04
Revenue / Forecast
9.10B / 8.85B
EPS Revisions
Last 90 days

People Also Watch

720.33
KLAC
-1.02%
505.13
VRTX
-1.29%
267.84
CDNS
+0.26%
267.76
COR
+0.10%
335.48
GEV
-2.36%

FAQ

What Is the Amgen (AMGN) Stock Price Today?

The Amgen stock price today is 304.36

What Stock Exchange Does Amgen Trade On?

Amgen is listed and trades on the NASDAQ stock exchange.

What Is the Stock Symbol for Amgen?

The stock symbol for Amgen is "AMGN."

Does Amgen Pay Dividends? What’s The Current Dividend Yield?

The Amgen dividend yield is 3.03%.

What Is the Amgen Market Cap?

As of today, Amgen market cap is 163.20B.

What is Amgen Earnings Per Share?

The Amgen EPS is 7.62.

What Is the Next Amgen Earnings Date?

Amgen will release its next earnings report on 22 Apr 2025.

From a Technical Analysis Perspective, Is AMGN a Buy or Sell?

Based on moving averages and other technical indicators, the daily buy/sell signal is Strong Sell.
Risk Disclosure: Trading in financial instruments and/or cryptocurrencies involves high risks including the risk of losing some, or all, of your investment amount, and may not be suitable for all investors. Prices of cryptocurrencies are extremely volatile and may be affected by external factors such as financial, regulatory or political events. Trading on margin increases the financial risks.
Before deciding to trade in financial instrument or cryptocurrencies you should be fully informed of the risks and costs associated with trading the financial markets, carefully consider your investment objectives, level of experience, and risk appetite, and seek professional advice where needed.
Fusion Media would like to remind you that the data contained in this website is not necessarily real-time nor accurate. The data and prices on the website are not necessarily provided by any market or exchange, but may be provided by market makers, and so prices may not be accurate and may differ from the actual price at any given market, meaning prices are indicative and not appropriate for trading purposes. Fusion Media and any provider of the data contained in this website will not accept liability for any loss or damage as a result of your trading, or your reliance on the information contained within this website.
It is prohibited to use, store, reproduce, display, modify, transmit or distribute the data contained in this website without the explicit prior written permission of Fusion Media and/or the data provider. All intellectual property rights are reserved by the providers and/or the exchange providing the data contained in this website.
Fusion Media may be compensated by the advertisers that appear on the website, based on your interaction with the advertisements or advertisers.
© 2007-2025 - Fusion Media Limited. All Rights Reserved.