It’s breakouts everywhere on stock markets and most of their risk proxies with Wall Street continuing its bounce led by tech stocks while European shares also lifted as risk sentiment firms despite the usual Sell in May shenanigans. The USD continues to fall back against the majors, particularly Euro while the Australian dollar has broken out above the 71 cent level alongside stocks. Commodity prices were somewhat bullish although oil prices failed to follow through on their recent breakout with Brent consolidating at the $115USD per barrel level while gold did the same, hovering just above the $1850SD per ounce level.
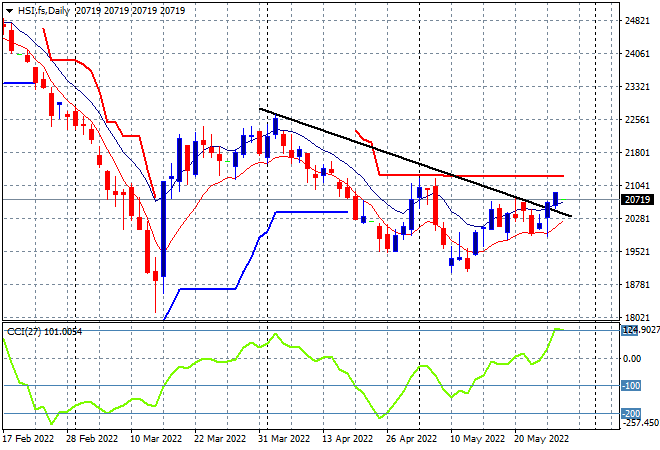
Looking at share markets in Asia from Friday’s session, where mainland Chinese share markets continued their rebound although the Shanghai Composite did have a wobble at the end of the session, finishing up just 0.2% higher to 3130 points while the Hang Seng Index zoomed much higher, up nearly 3% to close at 20697 points. The daily chart is showing price action getting more steam under it again but it remains contained below trailing daily ATR resistance at the 21000 point level that has firmed as strong resistance:
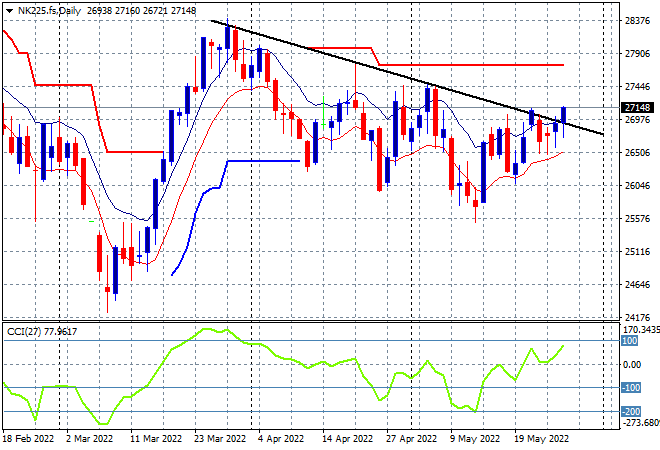
Japanese stock markets finally found some life with the Nikkei 225 index gaining nearly 0.7% to close at 26781 points. The daily chart of the Nikkei 225 still has a bearish bent with another attempt to get back above the previous daily/weekly highs near the 27500 point level possibly underway as risk sentiment firms. To properly reverse the downward trend from the March highs requires a substantial move above the 27000 point level with futures are indicating a solid start to the week, despite the stronger Yen trend:
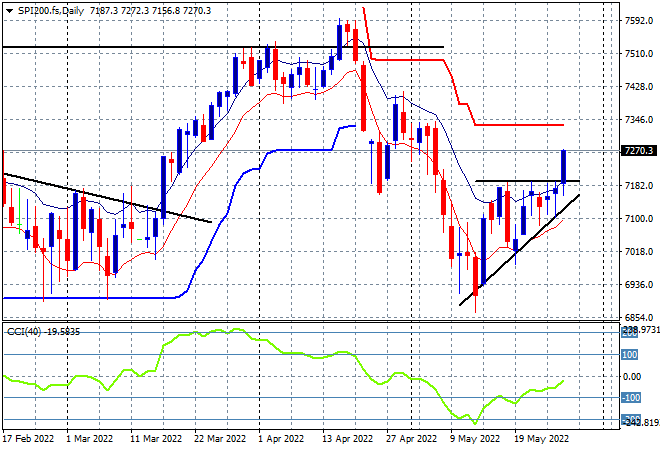
Australian stocks put in a solid session with the ASX200 finishing 1% higher at 7182 points, keeping the key 7100 point support level well intact. SPI futures are up another full 1% on the back of a super strong move on Wall Street on Friday night. The daily chart is showing a super clear breakout here with resistance at the 7200 point level to be cleared very quickly, even though daily momentum readings remain negative, it is normalising:
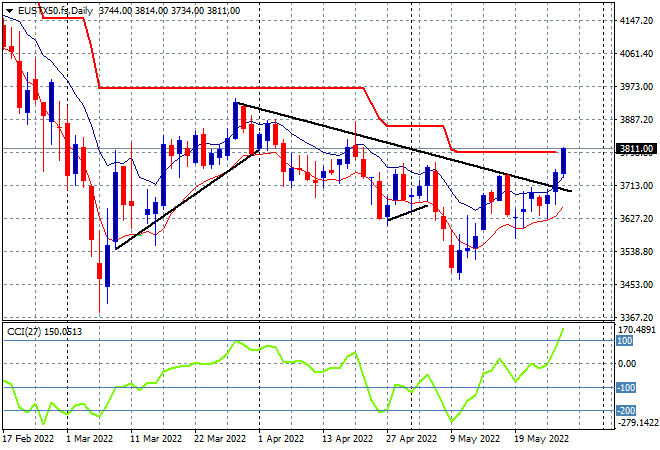
European markets started off with some mild bidding across the continent but continued to rebound as Wall Street joined in with the Eurostoxx 50 index finishing more than 1.8% higher at 3808 points. The daily chart picture is showing a breakout that could see a potential move through trailing ATR resistance that has been keeping this market contained since the Ukrainian invasion. With daily momentum flopping to the positive side, the upside potential is the 4000 point level:
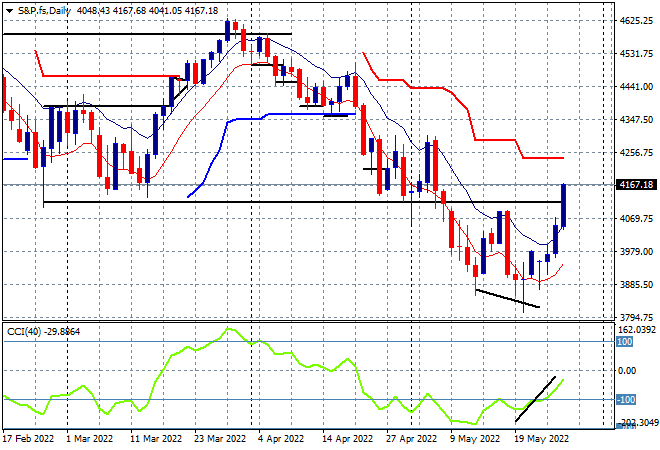
Wall Street capped off one of its best weeks for sometime now, with the NASDAQ bouncing the hardest again, up over 3% while the S&P500 closed more than 2.5% higher for the session, finishing the week well above previous resistance at the 4100 point level. The daily chart shows a big surge above that level that was support during the March rally but then failed during the April dip, so this maybe a false breakout, with daily momentum not yet positive:
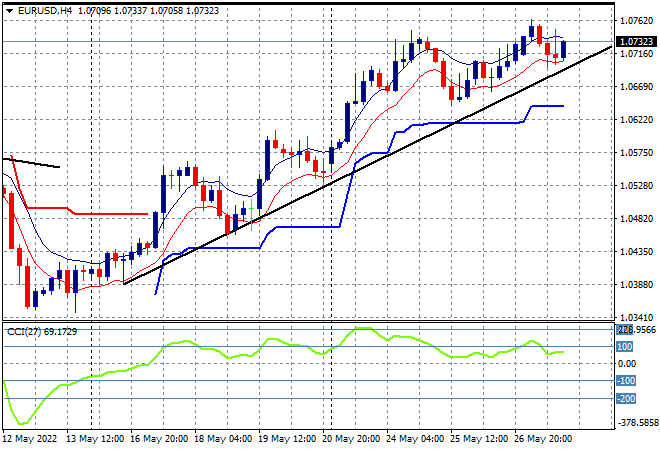
Currency markets saw continued USD weakness following last week’s GDP estimates with Euro solidifying at the 1.07 handle on Friday night, making another weekly high. This continues this medium term uptrend that has been solidified as trailing ATR support at the 1.06 level proper was defended and then raised. Watch for any retracement below the previous session lows at the mid 1.06 level to prove that wrong:
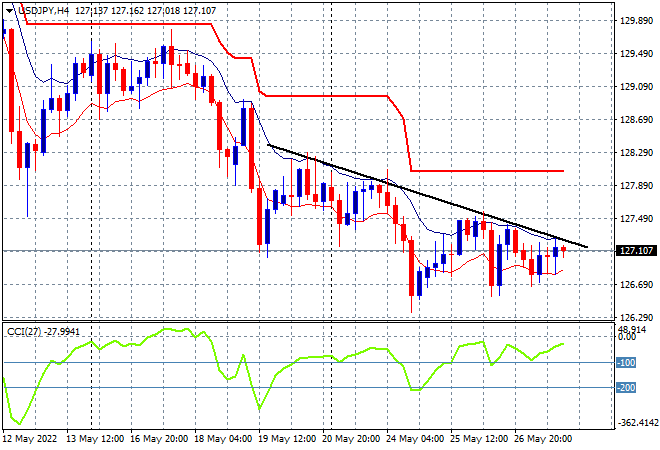
The USDJPY pair remained wobbly again with another pullback to the 127 level as defensive Yen bidding has not slowed despite risk markets rallying for new breakouts. The descending triangle pattern on the four hourly chart has not yet been negated to the upside as momentum remains negative, as it setups another rollover and back down to the 126 handle instead:
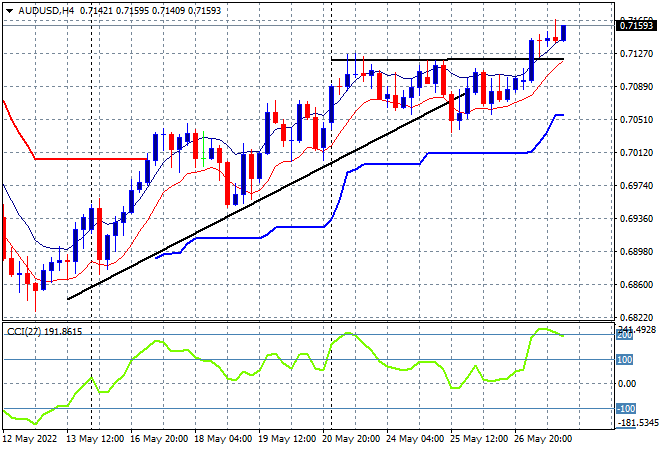
The Australian dollar was able to push past its recent highs after bunching up again at the 71 handle, following risk markets on Friday night to almost get to the 72 handle. Four hourly momentum is again at extremely overbought levels so we could see a small retracement at the start of the week before positioning for another breakout. The 71 cent level should provide solid support going forward:
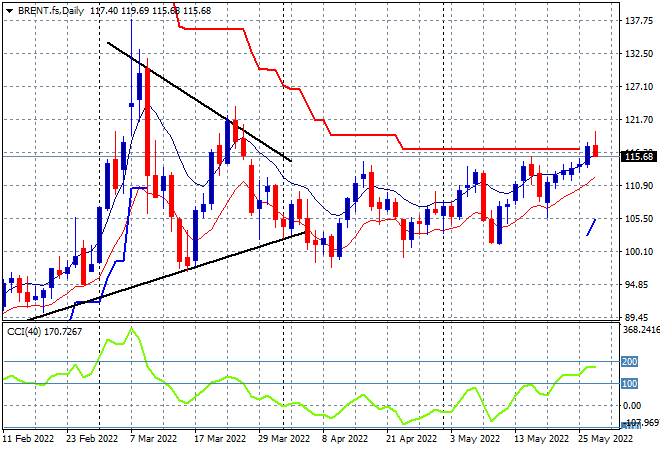
Oil markets broke out in the previous session and it was looking like a sterling finish to the week with another breakout for a new monthly high imminent, but Brent crude eventually closed back above the $115USD per barrel level. While this still exceeds its previous weekly high, it keeps price hovering near the trailing ATR daily resistance at the $116 area. Daily momentum is still properly overbought so that could encourage further upside as we start a new trading week:
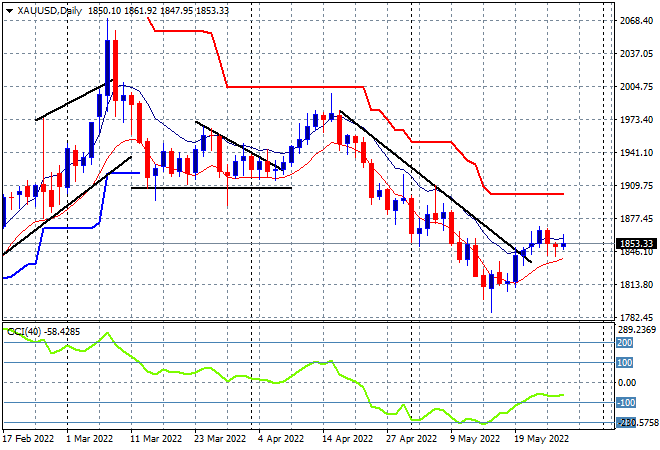
Gold stalled out again on Friday night, once again finishing near the $1850USD per ounce level, despite the USD losing some strength. While the downtrend from the April highs is likely over, daily momentum remains stuck in negative territory, with an inability to create a new daily high for over a week now weighing on the market. The January lows around the $1800 level remain the downside target that has yet to transform into a new support level: