Risk sentiment continued to gain positive momentum because the latest US domestic economic data supports the case for the US Federal Reserve to slow down or pause its rate hikes. This sent Wall Street to a one month high, while the USD retreated sharply against the majors. The Australian dollar got out of its funk but may experience another pullback on today’s CPI print. US bond markets saw a mild pullback with 10 year Treasury yields retreating to the 4.09% level as bond traders position for this week’s ECB meeting. Meanwhile commodities remain mixed, with oil prices steady as Brent crude finished at the $93USD per barrel level again while gold consolidated to steady at the $1650USD per ounce level.
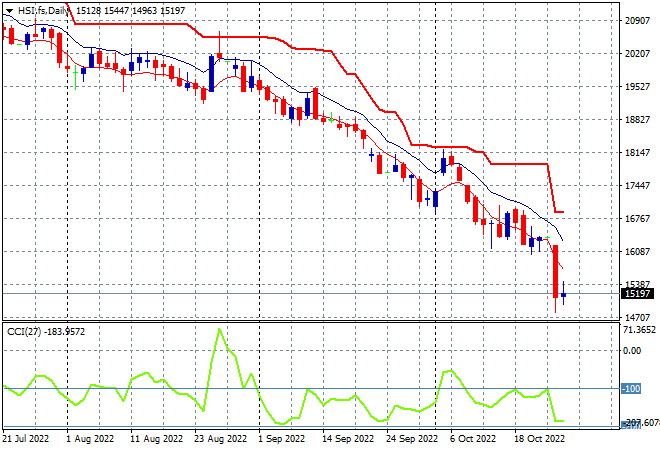
Looking at share markets in Asia from yesterday’s session where mainland Chinese share markets stabilised somewhat with the Shanghai Composite trying to get back above the 3000 point barrier with scratch session while the Hang Seng Index fell only 0.1% to remain well below the 16000 point level, closing at 15167 points. The daily chart shows how swift this decline has been, wiping out over a decade of returns – so far. Just below this level is the 2008 lows, which is where Chinese and other authorities will want to defend, but watch for the 15000 point level to come under threat next:
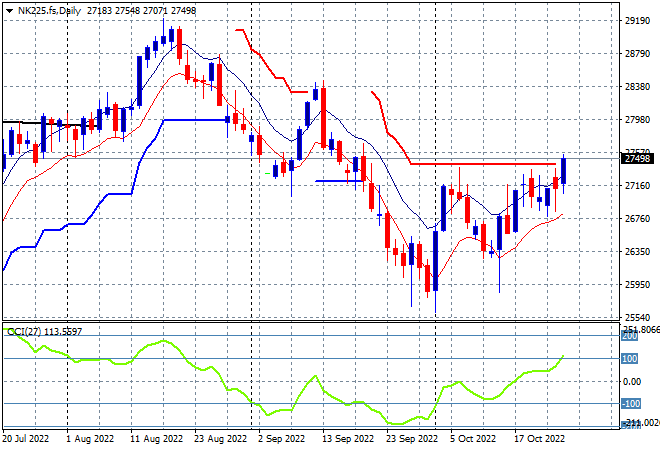
Japanese stock markets stood out from the crowd with the Nikkei 225 closing 1% higher to 27250 points. The daily price chart is showing a possible breakout brewing here under overhead resistance at the 27500 level with a very solid start to the trading week from Wall Street’s lead, with futures indicating another bullish session ahead today as momentum pushes through to an overbought reading:
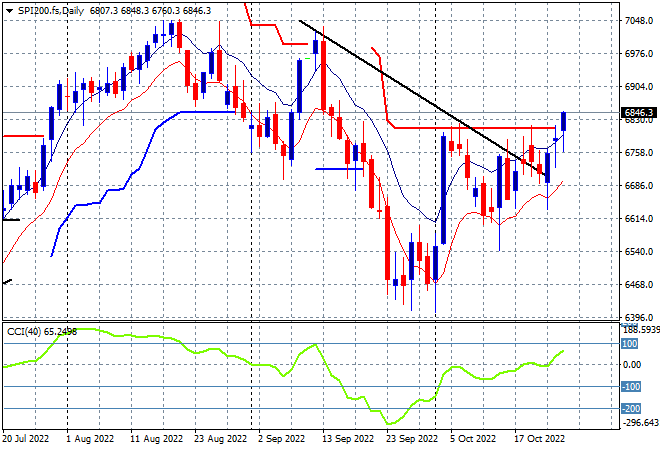
Australian stocks lagged somewhat but still put in a positive effort with the ASX200 closing more than 0.3% higher, almost creeping through the 6800 point level to close at 6798 points. SPI futures are up 0.8% on the follow through from Wall Street. The daily chart looks similar to Japanese stocks but futures are showing price action likely to push above key trailing ATR resistance at the 6800 point level. Daily momentum has finally crossed into the positive zone so its all lining up well:
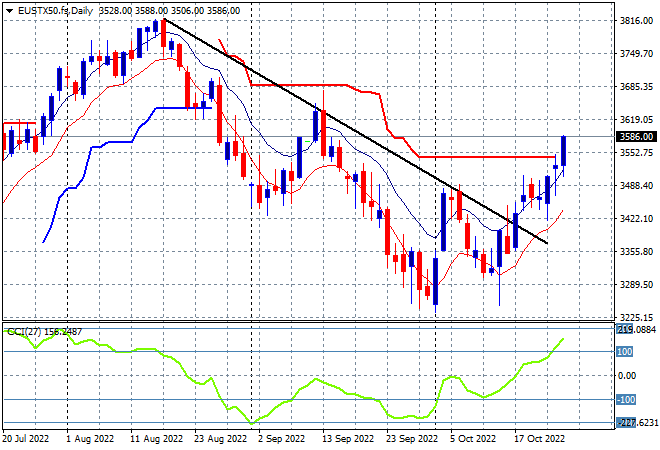
European stocks continued to rally on newfound confidence across the continent, although the FTSE put in a scratch session as the Eurostoxx 50 Index soared nearly 1.7% higher at 3585 points. The daily chart is also showing similar price action to Asian markets, but with more momentum as it clears resistance at the 3550 level which had been ominous overhead. The breakthrough of the downtrend from the August highs combined with overbought daily momentum should provide further moves higher here:
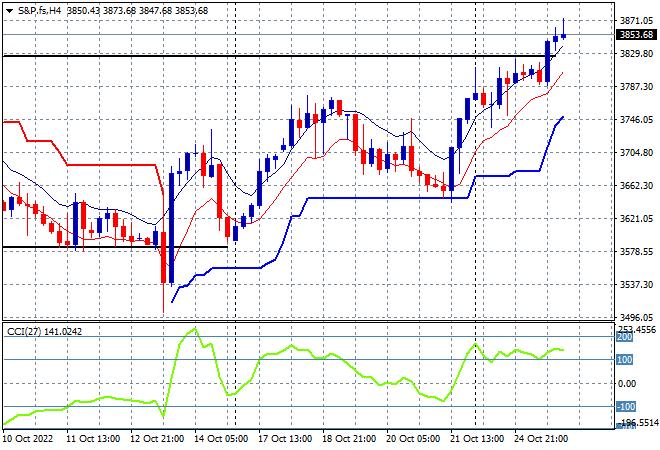
Wall Street also put in new highs across the board, with the NASDAQ leading the charge, up over 2% while the S&P500 closed 1.6% higher at 3859 points. The four hourly chart shows price action continuing its strong bounce off support at the 3640 point level and now clearing resistance at 3800 points that corresponded to the last failed high before this recent dip. Momentum is still in the overbought zone as with price action support building below as an inverse head and shoulders pattern completes its development with the 3900 point level the next obvious target:
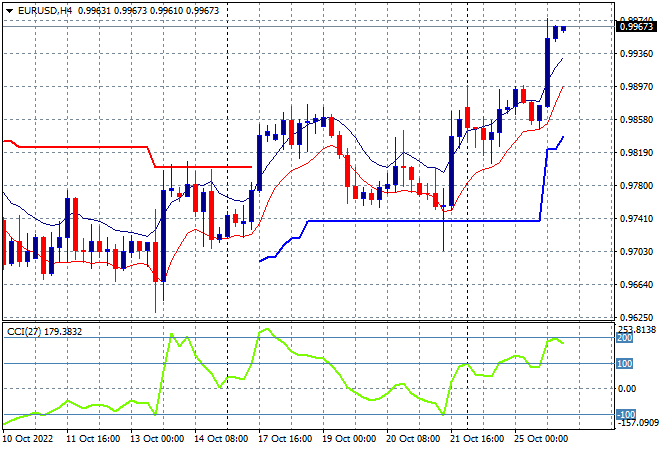
A sharp dip in US house prices sent the USD down sharply, with Euro building on to its gains to almost reach parity after dicing with the 99 handle in the previous session, reflecting the overall correlation with other risk markets. The union currency is looking to move higher here as we head into this week’s ECB meeting so watch for another run at parity with short term momentum quite overbought:
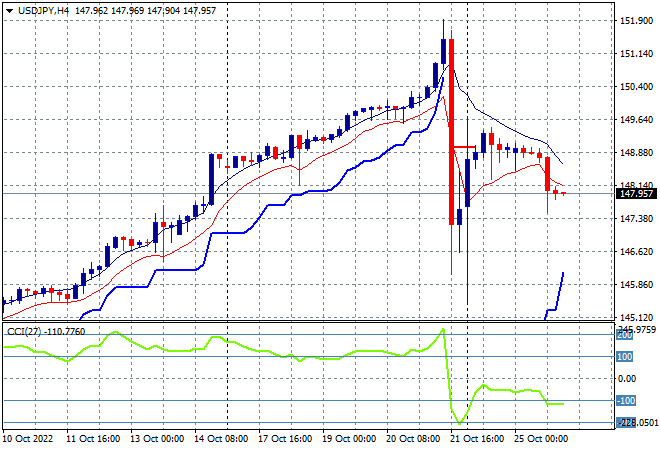
The USDJPY pair is failing to stabilise after some huge volatility on Friday, with another downleg overnight to finish this morning below the 148 handle. The recent unsustainable push higher, is unwinding as short term momentum is stuck in a negative position with price action finally moving to the lower edge of the moving average band and giving some sort of idea of future direction following this fantastic pullback:
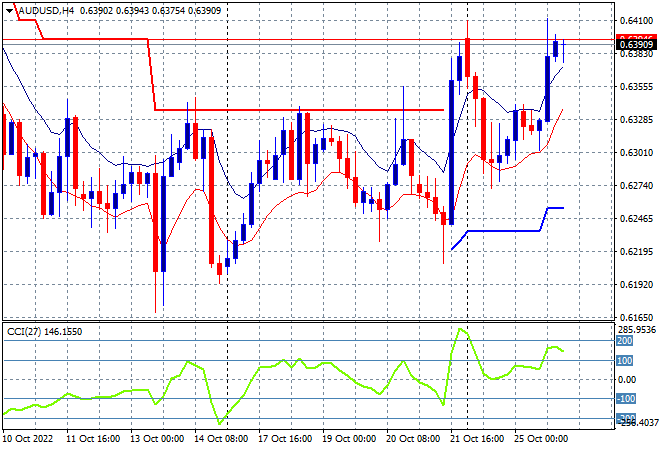
The Australian dollar had recently given back all of its recent substantial breakout, back last night again zoomed back higher after its recent clearance of ATR resistance at the 63.30 level to finish just shy of the 64 handle proper this morning. There remains a lot of internal weakness here, not just because of the over strong USD, with resistance just too strong at all the previous levels with the 65 handle still the area to beat in the medium term. Short term momentum is back to a positive setting with all eyes on today’s CPI print:
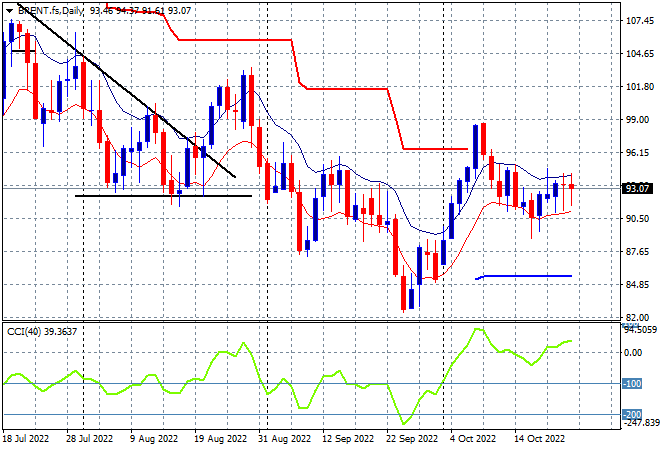
Oil markets were again unable to make any positive leaps higher with Brent crude hovering unchanged just above the $93USD per barrel level. Daily momentum is switching back and forth from mildly positive and negative settings, but neither oversold or overbought yet either, with price action able to stave off another close below the low moving average. Without a close above the high moving average soon, a probable return to the dominant downtrend still on the cards:
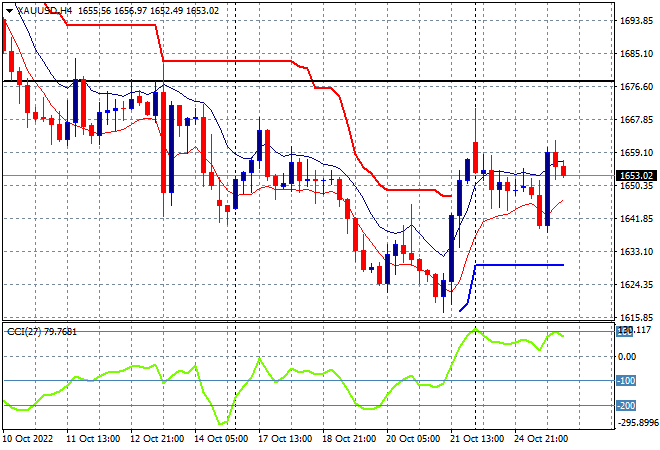
Gold is still holding on to its Friday night gains with reduced volatility again overnight, hovering just above the $1650USD per ounce level. Recent price action had been showing internal weakness in the shiny metal as it was unable to clear easy resistance levels, but this one off move provides some relief. However, the multi-monthly bearish setup remain in place and while this could be yet another early bottoming action, there is substantial resistance to clear first: