Wall Street put in a new record high as the latest Nvidia earnings and buzz around AI pushed the whole edifice up, dragging along European stocks as well as the latest global PMI readings came in better than expected. This saw bond markets sell off again as yields rose across the complex while the USD pulled back slightly with Euro putting in a new high while the Australian dollar again stuck at the mid 65 cent level.
10 year Treasury yields pushed through the 4.3% level, flattening the yield curve while oil prices continue to edge slightly higher as Brent crude advanced past the $83USD per barrel level. Meanwhile gold slipped back to fall back down to the $2020USD per ounce level.
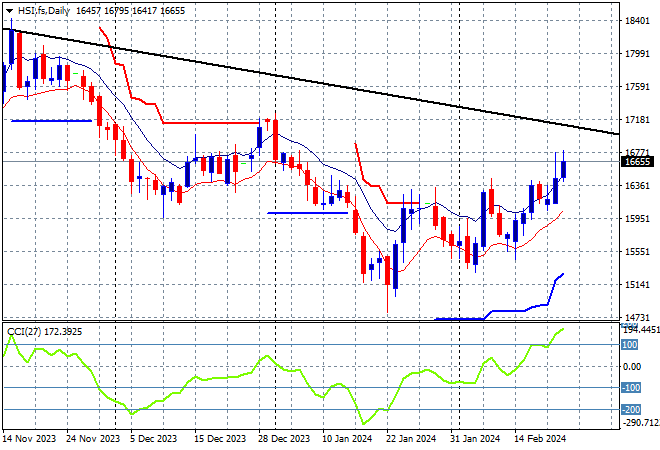
Mainland and offshore Chinese share markets are continuing their post break rally with the Shanghai Composite up 1.2% while the Hang Seng is up nearly 1% to 16651 points.
The daily chart is starting to look more optimistic with price action bunching up and now exceeding the 16000 point level, ready to possibly burst out here and make a run for the end of 2023 highs at 17000:
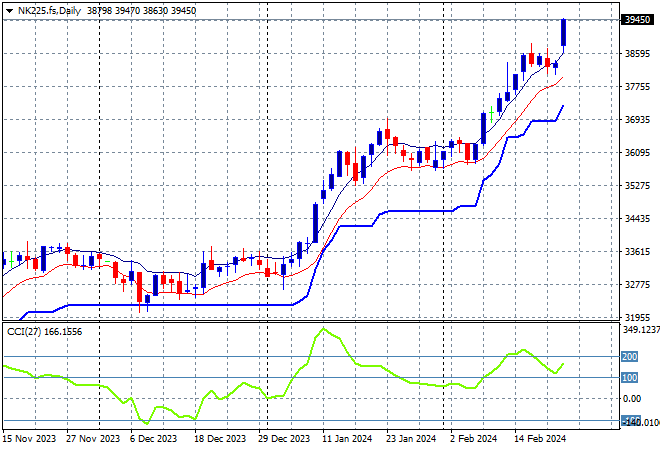
Japanese stock markets were playing catchup with a big rally as the Nikkei 225 closes 2.2% higher at 39098 points.
Trailing ATR daily support was never threatened by price action after this bounce went beyond the September highs at the 33000 point level with daily momentum getting back to overbought readings with a significant breakout. A selloff back to ATR support at 32000 points remains unlikely as the November highs are wiped out in this breakout but I’m cautious of a strong pullback here on any volatility:
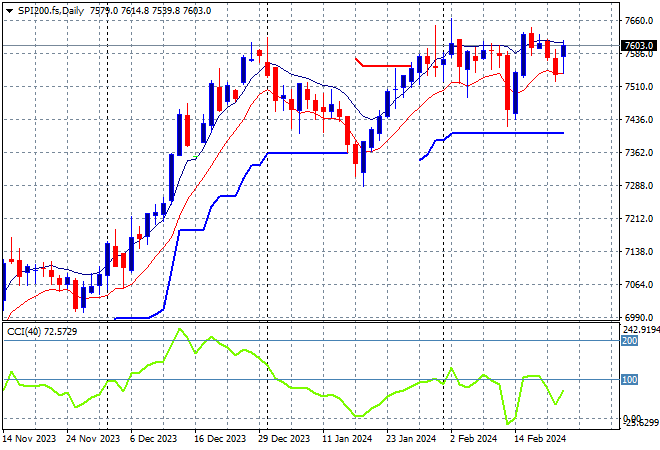
Australian stocks were flat with the ASX200 closing just above the 7600 point level at 7611 points.
SPI futures are indicating at least a 0.4% rise on the open given the big upside volatility on Wall Street overnight. The daily chart was looking firmer with the medium term uptrend and short term price action coming together to take out the previous December highs. As I said previously, watching for any continued dip below the low moving average could see a significant pullback but watch ATR support which has been defended so far:
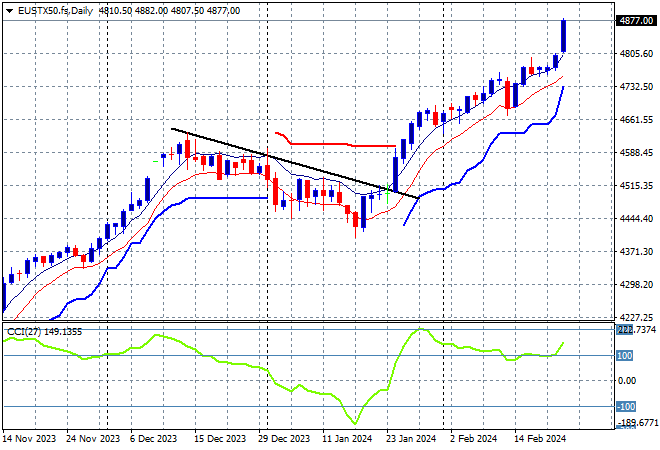
European markets rallied hard across the continent, with the FTSE also playing catchup with the Eurostoxx 50 Index eventually finishing some 1.7% higher at 4855 points.
The daily chart shows price action still on trend after breaching the early December 4600 point highs but daily momentum has now retraced from being well overbought with futures a pullback this evening. This is looking to turn into a larger breakout but watch for any falls below the low moving average or ATR support proper:
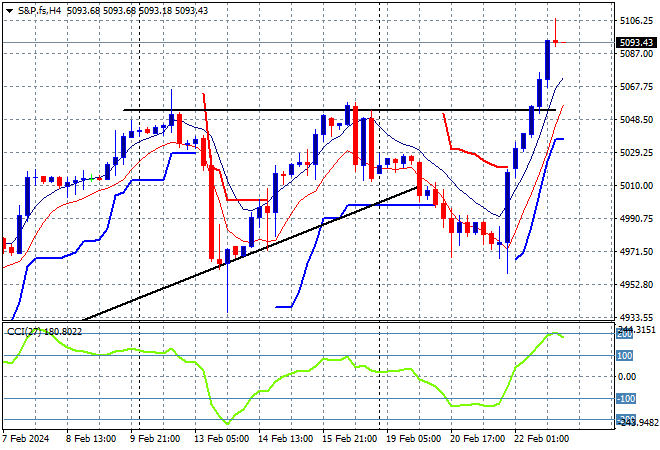
Wall Street put in a new record high, lead by tech stocks with the NASDAQ soaring nearly 3% while the S&P500 finished over 2% higher in a very strong session, bursting through the magical 5000 point level to close at 5087 points.
The four hourly chart previously showed short term momentum trying to get out of oversold territory with a nascent bearish double head pattern plus a break below the daily trend line from the January lows broken. This is all put aside as price soars back above the 5000 point level with a new breakout above the previous weekly highs:
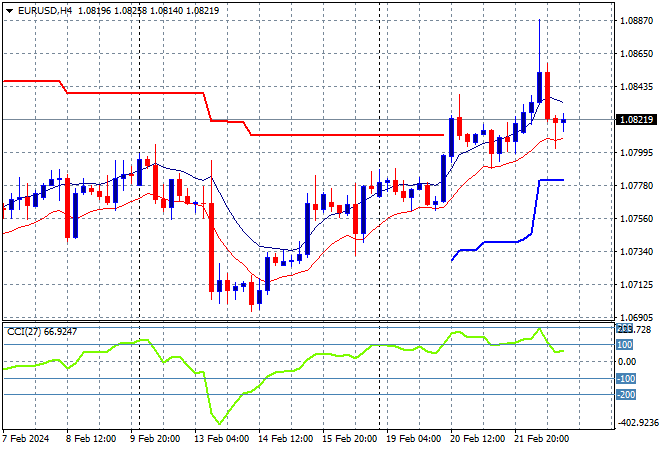
Currency markets are still somewhat anti USD given the calm reaction to the latest FOMC minutes with Euro still on track although it managed a round trip around the 1.08 handle proper.
The union currency had already been at a new weekly low almost below the 1.07 level but this was taken out and then some for a new monthly low, hovering over that level this morning. Short term momentum has reversed into overbought mode, with price action now above trailing ATR resistance:
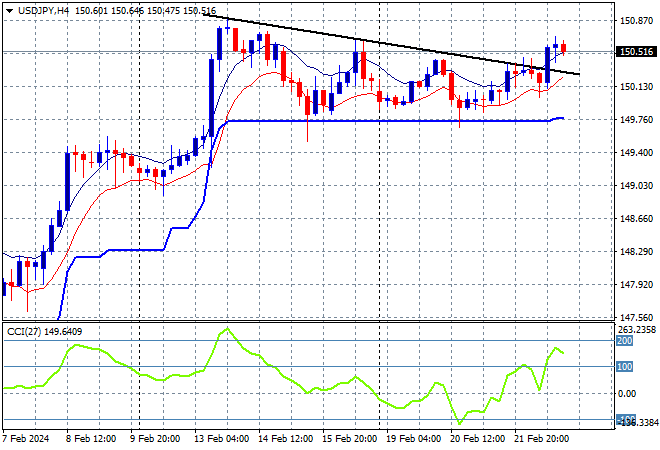
The USDJPY pair remains stable with a small breakout above the descending triangle pattern on the four hourly chart that takes it to the mid 150 handle but basically unchanged since the minor late bounce last week.
This was looking very optimistic as Yen sells off due to BOJ meanderings with momentum now retracing to slightly negative settings in the short term, so I’m watching for any major pullback to the 150 level proper as part of a mid trend consolidation:
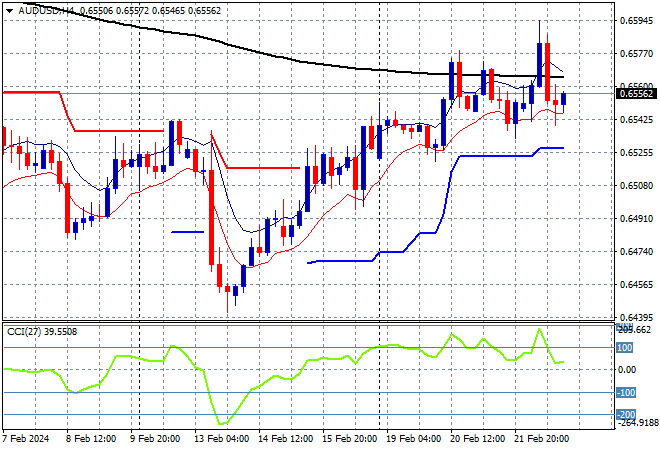
The Australian dollar is no longer experiencing its recent pressure cooker following the US inflation prints and some possible direction from the RBA, with some deflation overnight from its recent two week high above the mid 65 cent level as it again fails to breach the 66 handle.
The Aussie has been under medium and long term pressure for sometime with the short term moves above the 65 level setting up for another breakout the mid 65 cent area:
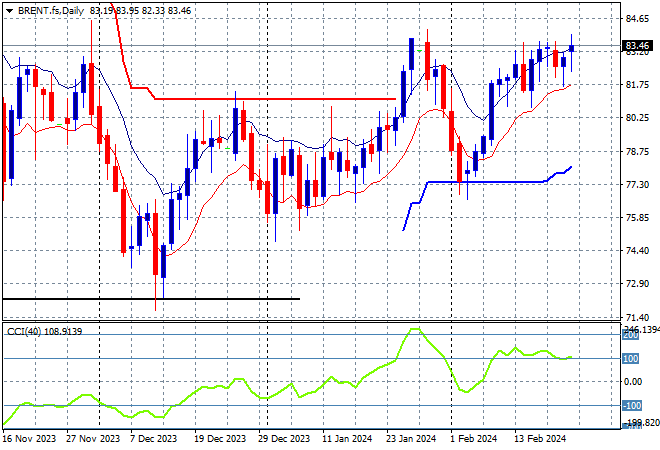
Oil markets tried to lift much higher but Brent crude stayed stubbornly at just above the $83USD per barrel level as it continues to reject the previous weekly high overnight.
After retracing down to trailing ATR daily support at the $77 level, price is still above the weekly resistance levels that so far have held from the January false breakout with the short term target the late January highs above $84 still the next target:
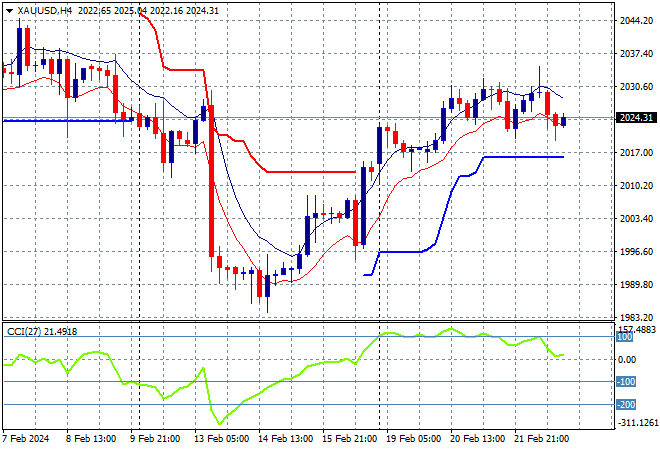
Gold is still trying to get out of its formerly depressed state following the US CPI print last week with this rebound slipping slightly in the later session overnight after almost breaching the $2030USD per ounce level.
Daily momentum is no longer oversold with short term support at the $2000 level the critical area to watch with a further session highs and a bounce above short term ATR resistance required to stay on trend: