Stock markets pulled back again last night following a stronger than expected ISM manufacturing print, pushing the USD up and sending bond yields higher, with the 10 Year Treasury yield almost hitting the 3% level again. Euro dropped on more ECB hawkish talk of rate rises, with the Canadian central bank joining the party with an expected rate rise, a prelude to the RBA doing so next week which is keeping the Australian dollar contained around the 72 cent level. Commodity prices were mixed as oil prices retraced slightly while copper lifted and gold fell back further below the $1850USD per ounce level.
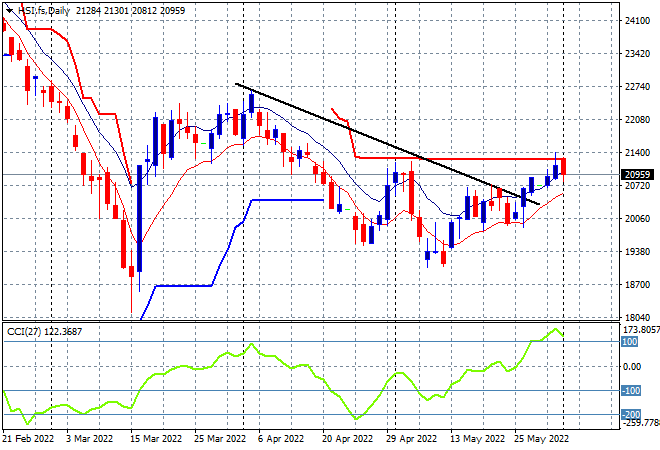
Looking at share markets in Asia from yesterday’s session, where mainland Chinese share markets were basically stuck with the Shanghai Composite closing down 0.2% to 3181 points while the Hang Seng Index was unable to build on its recent gains, down 0.6% to 21294 points. The daily chart is showing price wanting to get above trailing daily ATR resistance at the 21000 point level but failing to turn this into a sustainable trend. Daily momentum is still overbought but not translating into greater highs:
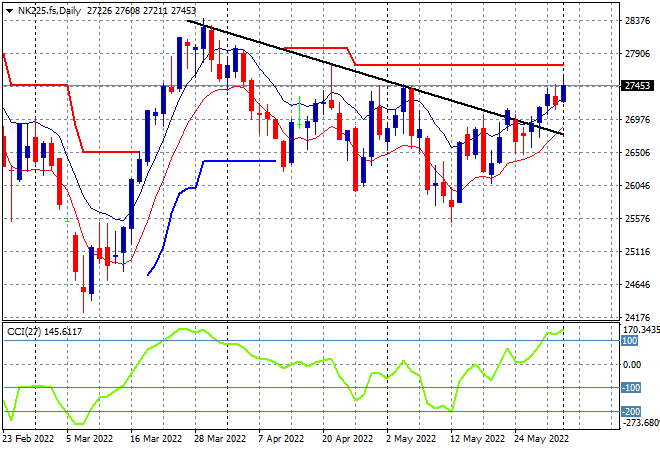
Japanese stock markets however did well, with the Nikkei 225 index up more than 0.6% at 27457 points. The daily chart of the Nikkei 225 is slowly losing its bearish bent with another attempt to get back above the previous daily/weekly highs near the 27500 point level underway, helped by a very weak Yen. To properly reverse the downward trend from the March highs requires a substantial move above the 27000 point level with futures indicating a hold on this current melt up rally:
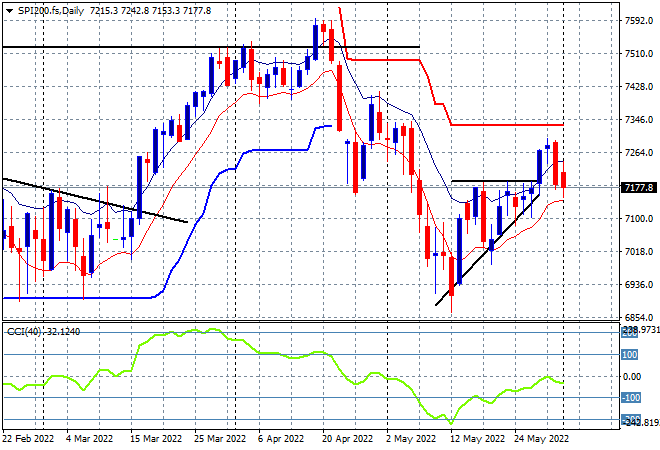
Australian stocks oscillated all day after absorbing the latest GDP print with the ASX200 closing nearly 0.3% higher at 7233 points. SPI futures are down more than 50 points or at least 0.6% due to the poor lead from Wall Street overnight. The daily chart was showing a clear breakout here with resistance at the 7200 point level cleared very quickly, but the bearish engulfing candle combined with daily negative momentum readings suggest we are going to see another flop here to the downside:
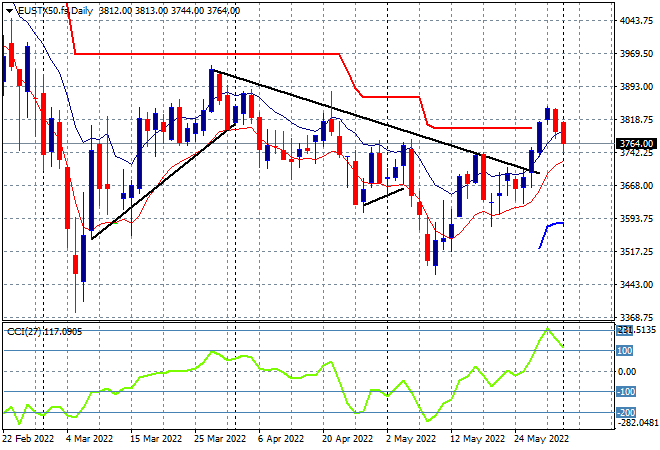
Europe (plus the UK) was a sea of red again overnight with the Eurostoxx 50 index finishing 0.8% lower at 3759 points. The daily chart picture is similarly showing a failed breakout that has stalled above the trailing ATR resistance level that had been keeping this market contained since the Ukrainian invasion. With continued concerns about inflation, this breakout might be over before it even starts, so watch for a fall below the low moving average next:
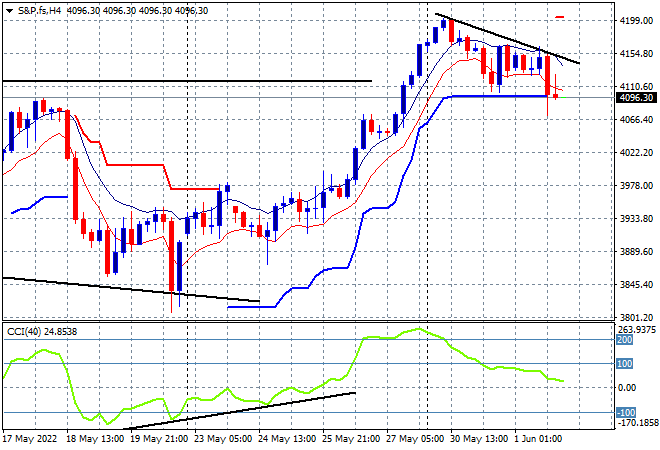
Wall Street was unable to gain any ground last night as confidence falters, with the NASDAQ off by 0.7% to cross back below the 20000 point level while the S&P500 lost 0.7% to finish just above the 4100 point level. The four hourly chart shows how this pullback is slowly turning into a reversal with trailing ATR support at the previous 4100 point resistance level barely holding on with a descending triangle pattern now fully formed. Daily momentum readings are key here – they are only barely positive so watch for any break below that 4100 point level:
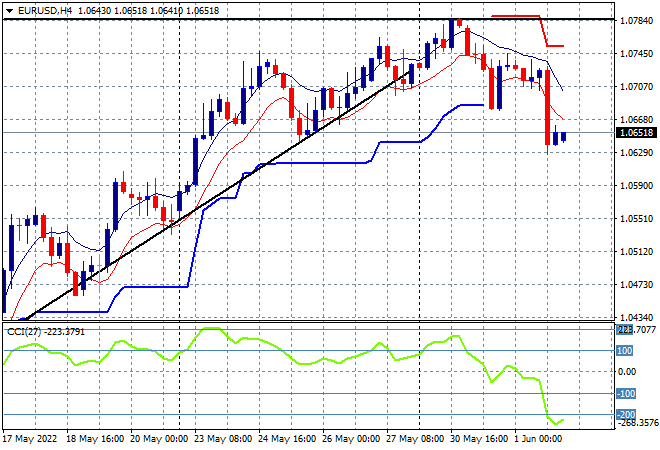
Currency markets saw USD come back to strength on the ISM print despite more ECB hawks stepping up their concerns about European inflation. The Euro collapsed down below the 1.07 handle to be at the mid 1.06 level this morning, having reversed its trend that topped out at the 2020 lows (upper horizontal black line) at the start of the week. The level is acting as very strong resistance here and this flop may well negate the medium term uptrend that had been solidifying:
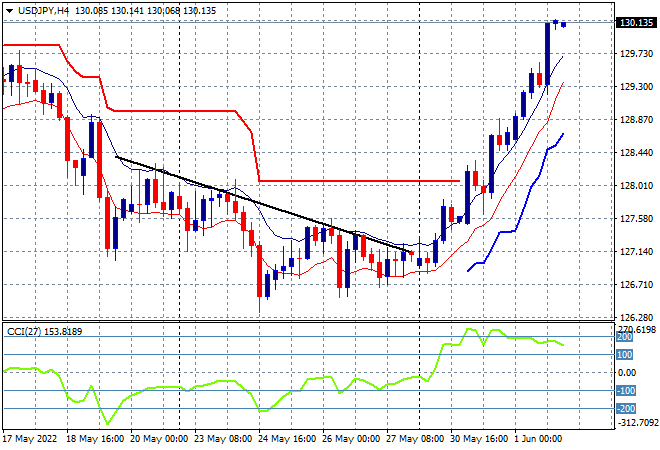
The USDJPY pair found more life overnight with a surge through the 130 level that has held on this morning, looking extremely overdone in the process as it too moves on the words of central bankers. Short term momentum remains highly overbought as a result, with trailing ATR resistance at the 128 handle proper cast aside, but I’m wary of a volatile retracement coming:
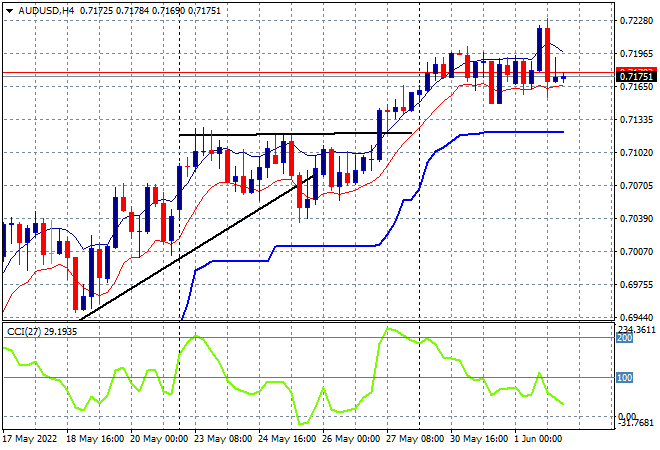
The Australian dollar tried again to push through the 72 handle overnight, making a false breakout that was slammed back down below that level later in the session. Four hourly momentum has retraced from its extremely overbought levels so we could a further move down as short term price action can’t get through substantial resistance at the 72 cent level, or it could be more positioning before yet another breakout. The previous resistance level at 71 cents (upper black horizontal line) should provide solid support going forward:
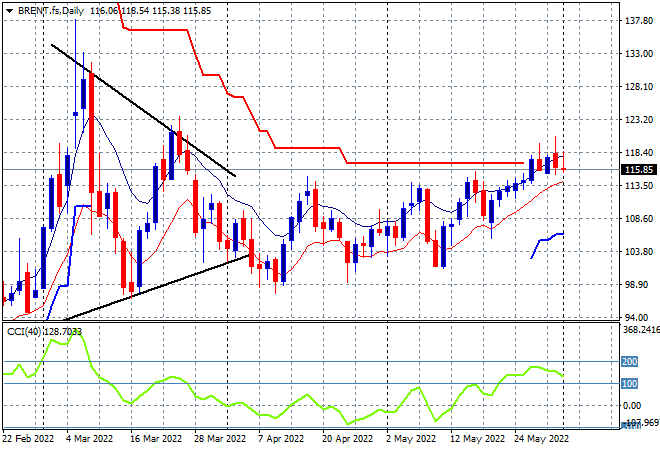
Oil markets tried to push higher overnight but both WTI and Brent couldn’t make a new daily high, with the latter stalling out below the $116USD per barrel level. While this keeps it near its weekly high, price hovering at the trailing ATR daily resistance is not a good sign of further upside potential. Daily momentum is very overextended and overbought so that should normally encourage further upside, but watch those overhead selling tails that are pointing to building resistance:
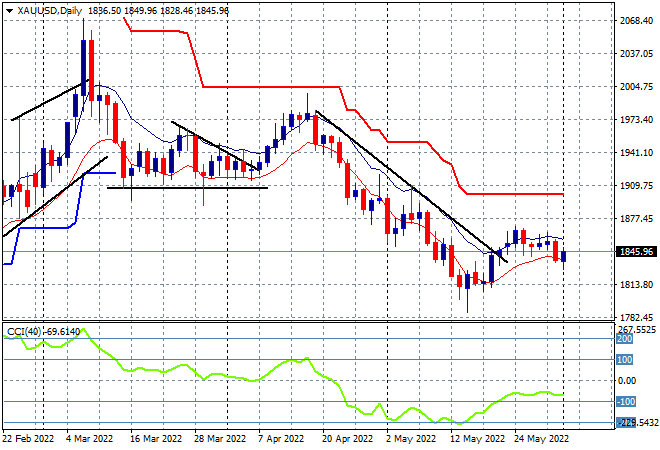
Gold had another retracement overnight, but actually finished up for the session to finish at the $1845USD per ounce level, despite the USD gaining strength against the majors. The last week of price action is pointing to a rejoining of the downtrend from the April highs as daily momentum remains stuck in negative territory, with an inability to create a new daily high for over a week. The January lows around the $1800 level remain the downside target that has yet to transform into a new support level: