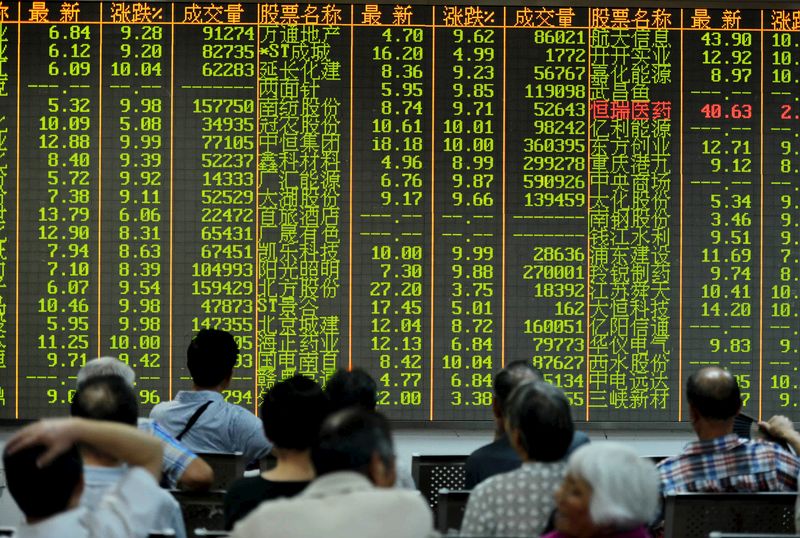
* China yuan skids to fresh 6-month low, stocks follow
* Oil sharply higher as US pressures allies on Iran crude
* Asian markets hesitant amid trade uncertainty
* Yen firmer as trade-sensitive currencies ease
By Wayne Cole
SYDNEY, June 27 (Reuters) - Asian share markets were under stress on Wednesday as further falls in Chinese stocks and the yuan sent ripples across the region, while oil climbed as the United States leaned on allies to stop buying Iranian crude.
Chinese blue chips .CSI300 sank 2.2 percent to be a whisker above 13-month lows as a resolution of Sino-U.S. tensions remained a distant prospect.
MSCI's broadest index of Asia-Pacific shares outside Japan .MIAPJ0000PUS lost another 0.6 percent after touching a two-year trough on Tuesday.
Japan's Nikkei .N225 had been faring better but soon succumbed to risk aversion and fell 0.3 percent.
European shares were expected to open flat, while E-mini futures for the S&P 500 ESc1 were off 0.18 percent.
The fragile mood in Asia overshadowed gains in energy stocks made after news broke that Washington was pushing allies to halt imports of Iranian crude. crude CLc1 added 17 cents to $70.70, having surged 3.6 percent overnight, while Brent LCOc1 climbed 18 cents to $76.49 a barrel.
The jump in oil boosted the Wall Street energy sector 1.4 percent .SPNY , making it the biggest gainer on the S&P 500.
But the S&P .SPX still only managed to add 0.22 percent overall, while the Dow .DJI rose 0.12 percent and the Nasdaq .IXIC was up 0.39 percent.
Confusion remained the watchword with U.S. trade policy.
The U.S. House of Representatives overwhelmingly passed a bill on Tuesday to tighten foreign investment rules, spurred by bipartisan concerns about Chinese bids to acquire sophisticated U.S. technology. President Donald Trump also endorsed a measured approach to restricting Chinese investments in U.S. technology companies, saying a strengthened merger security review committee could protect sensitive technologies. remain of the view that a large scale "trade war" remains a low probability though the odds of it happening appear to have increased," said JPMorgan (NYSE:JPM) economist David Hensley.
He noted that the latest tariff threats from the White House would cover more than 30 percent of U.S. imports, equal to almost 5 percent of annual economic output (GDP).
"If all this were to happen, and U.S. trading partners were to retaliate, it would deliver a significant supply shock to the world economy, raising inflation and lowering growth."
BACK TO YUAN WATCHING
In currency markets, trade-sensitive currencies including the Australian and New Zealand dollars lost ground while the safe-haven yen found demand. The kiwi dollar hit its lowest in seven months at $0.6812 NZD=D4 .
The U.S. dollar was broadly steady against a basket of currencies at 94.661, after bouncing from 94.171 on Tuesday. The euro EUR= was back at $1.1650, having run into profit-taking at a top of $1.1720 overnight.
Yet the dollar could not sustain gains on the yen and eased back to 109.85 from an early 110.12 JPY= .
The dollar has been aided in part by recent gains on the Chinese yuan, which has stirred speculation Beijing was allowing its currency to weaken to bolster exports.
The People's Bank of China (PBOC) fixed the yuan midpoint CNY=PBOC at a six-month low of 6.5569 per dollar on Wednesday. That was down 0.6 percent from the previous fix but actually a little firmer than market expectations.
However, the spot rate continued to slip with the yuan breaking past 6.6600 per dollar for the first time since December. PBOC's preference might be to allow moderate weakening, pulling back if depreciation pressures started intensifying. But that's a difficult balance to strike. The chances of a sizeable depreciation have risen," economists at Capital Economics said in a note.
In commodity markets, gold was seemingly no longer considered a safe haven by investors and hit its lowest in more than six months.
Spot gold XAU= was last at $1,255.93 having hit its weakest since mid-December at $1,253.00.
<^^^^^^^^^^^^^^^^^^^^^^^^^^^^^^^^^^^^^^^^^^^^^^^^^^^^^^^^^^^ MSCI and Nikkei chart
http://reut.rs/2sSBRiD
^^^^^^^^^^^^^^^^^^^^^^^^^^^^^^^^^^^^^^^^^^^^^^^^^^^^^^^^^^^> (Editing by Shri Navaratnam and Eric Meijer)
