Trinity Industries Inc (TRN)

Currency in USD
35.08
+0.50(+1.45%)
Closed·
35.00-0.08(-0.23%)
·
TRN is not included in our AI-picked strategies. See which stocks are.
Fair Value
Day's Range
34.1435.36
52 wk Range
22.3835.62
Key Statistics
Prev. Close
34.58
Open
34.34
Day's Range
34.14-35.36
52 wk Range
22.38-35.62
Volume
1.07M
Average Volume (3m)
774.68K
1-Year Change
2.0064%
Book Value / Share
12.38
Fair Value
unlockUnlock
Fair Value Upside
unlockUnlock
TRN Scorecardpro icon
Company’s Health
Unlock
Fair Value
Unlock Price
Fair Price
Upside
Price Target
30.50
Downside
-13.06%
Members' Sentiments
Bearish
Bullish
ProTips
Has raised its dividend for 15 consecutive years

Trinity Industries Inc News & Analysis

Show more

Technical Analysis

Summary
Strong Sell
Sell
Neutral
Buy
Strong Buy
Strong Buy
Technical Indicators
Strong Buy
Moving Averages
Strong Buy

Trinity Industries Inc Company Profile

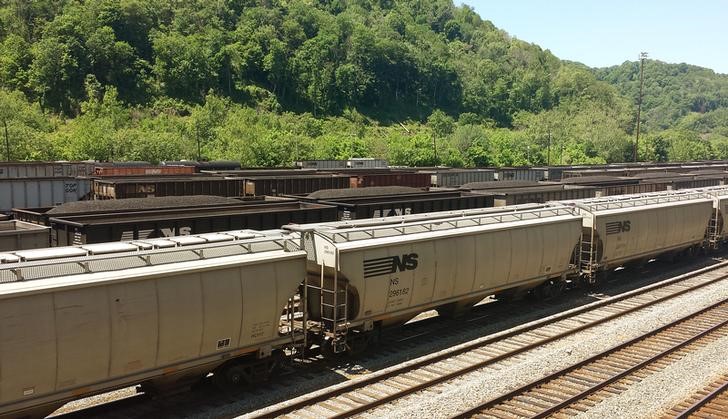
Trinity Industries, Inc. provides railcar products and services under the TrinityRail trade name in North America. It operates in two segments, Railcar Leasing and Services Group, and Rail Products Group. The Railcar Leasing and Services Group segment leases freight and tank railcars; originates and manages railcar leases for third-party investors; and provides fleet leasing, management, and administrative services, as well as railcar maintenance and modification services, and other railcar logistics products and services. As of December 31, 2023, it had a fleet of 109,635 railcars. This segment serves industrial shipper and railroad companies operating in agriculture, construction and metals, consumer products, energy, and refined products and chemicals markets. The Rail Products Group segment manufactures freight and tank railcars for transporting various liquids, gases, and dry cargo; and manufactures and sells railcars and related parts and components. This segment serves railroads, leasing companies, and industrial shippers of products in the refined products and chemicals, energy, agriculture, construction and metals, and consumer products markets. It sells or leases products and services through its own sales personnel and independent sales representatives. The company was incorporated in 1933 and is headquartered in Dallas, Texas.

Trinity Industries Inc Earnings Call Summary for Q4/2025

  • Trinity Industries (TRN) reported Q4 2025 EPS of $2.31 vs $0.70 forecast (230% surprise) and revenue of $611M vs $538.95M forecast, driving an 8.08% pre-market stock surge
  • Full-year EPS reached $3.14, up 73% year-over-year, with adjusted return on equity at 24.4% despite revenue declining to $2.2 billion for the fiscal year
  • The company maintained a 30-40% market share in industry deliveries while investing heavily in AI technologies to enhance operational efficiency
  • Management provided 2026 guidance with EPS of $1.85-$2.10, rail segment operating margin of 5-6%, and projected $450-550M investment in net lease fleet
  • CEO Jean Savage expressed cautious optimism about market recovery, projecting return to replacement-level demand in 2027 while expecting 2026 to remain subdued
Last Updated: 13/02/2026, 12:52 am
Read Full Transcript

Compare TRN to Peers and Sector

Metrics to compare
TRN
Peers
Sector
Relationship
P/E Ratio
10.8x40.5x12.7x
PEG Ratio
−0.610.720.03
Price/Book
2.6x4.0x1.4x
Price / LTM Sales
1.3x2.2x1.3x
Upside (Analyst Target)
−13.1%−0.6%15.3%
Fair Value Upside
Unlock−14.8%4.9%Unlock

Analyst Ratings

0 Buy
2 Hold
0 Sell
Ratings:
2 analysts
Overall Consensus
Neutral

Analysts 12-Month Price Target:

Average 30.50
(-13.06% Downside)
Firm
ArticlePositionPrice TargetUpside / DownsideFrom Price TargetActionDate
Susquehanna
Hold34.00-3.08%28.00Maintain13/02/2026
Goldman Sachs
Hold33.00-5.93%29.00Maintain13/02/2026
Susquehanna
Hold28.00-20.18%23.00Maintain26/01/2026
Susquehanna
Hold24.00-31.58%26.00Maintain29/07/2025
Susquehanna
Hold24.00-31.58%35.00Maintain22/04/2025

Dividends

Payout Ratio
Payout ratio (TTM)
Earnings retained
EPS 1.17%
Dividend Yield
3.53%
Industry Median 1.51%
Annualised payout
1.24
Paid quarterly
5-Years Growth
+9.57%
Growth Streak

Earnings

Latest Release
Feb 12, 2026
EPS / Forecast
2.31 / 0.70
Revenue / Forecast
611.00M / 538.95M
EPS Revisions
Last 90 days

TRN Income Statement

People Also Watch

71.46
EIX
+3.45%
115.79
WEC
+1.54%
105.07
ETR
+3.05%
144.94
DTE
+2.86%
46.36
NI
+2.61%

FAQ

What Is the Trinity Industries (TRN) Stock Price Today?

The Trinity Industries stock price today is 35.08

What Stock Exchange Does Trinity Industries Trade On?

Trinity Industries is listed and trades on the New York Stock Exchange.

What Is the Stock Symbol for Trinity Industries?

The stock symbol for Trinity Industries is "TRN."

Does Trinity Industries Pay Dividends? What’s The Current Dividend Yield?

The Trinity Industries dividend yield is 3.53%.

What Is the Trinity Industries Market Cap?

As of today, Trinity Industries market cap is 2.81B.

What Is Trinity Industries's Earnings Per Share (TTM)?

The Trinity Industries EPS (TTM) is 1.17.

When Is the Next Trinity Industries Earnings Date?

Trinity Industries will release its next earnings report on 06/05/2026.

From a Technical Analysis Perspective, Is TRN a Buy or Sell?

Based on moving averages and other technical indicators, the daily buy/sell signal is Strong Buy.

How Many Times Has Trinity Industries Stock Split?

Trinity Industries has split 6 times.

How Many Employees Does Trinity Industries Have?

Trinity Industries has 7380 employees.

What is the current trading status of Trinity Industries (TRN)?

As of 14 Feb 2026, Trinity Industries (TRN) is trading at a price of 35.08, with a previous close of 34.58. The stock has fluctuated within a day range of 34.14 to 35.36, while its 52-week range spans from 22.38 to 35.62.

What Is Trinity Industries (TRN) Price Target According to Analysts?

The average 12-month price target for Trinity Industries is USD30.50, with a high estimate of USD33 and a low estimate of USD28. 0 analysts recommend buying the stock, while 0 suggest selling, leading to an overall rating of Neutral. The stock has an -13.06% Downside potential.

What Is the TRN Premarket Price?

TRN's last pre-market stock price is 34.52. The pre-market share volume is 100.00, and the stock has decreased by -0.06, or -0.17%.

What Is the TRN After Hours Price?

TRN's last after hours stock price is 35.00, the stock has decreased by -0.08, or -0.23%.
Risk Disclosure: Trading in financial instruments and/or cryptocurrencies involves high risks including the risk of losing some, or all, of your investment amount, and may not be suitable for all investors. Prices of cryptocurrencies are extremely volatile and may be affected by external factors such as financial, regulatory or political events. Trading on margin increases the financial risks.
Before deciding to trade in financial instrument or cryptocurrencies you should be fully informed of the risks and costs associated with trading the financial markets, carefully consider your investment objectives, level of experience, and risk appetite, and seek professional advice where needed.
Fusion Media would like to remind you that the data contained in this website is not necessarily real-time nor accurate. The data and prices on the website are not necessarily provided by any market or exchange, but may be provided by market makers, and so prices may not be accurate and may differ from the actual price at any given market, meaning prices are indicative and not appropriate for trading purposes. Fusion Media and any provider of the data contained in this website will not accept liability for any loss or damage as a result of your trading, or your reliance on the information contained within this website.
It is prohibited to use, store, reproduce, display, modify, transmit or distribute the data contained in this website without the explicit prior written permission of Fusion Media and/or the data provider. All intellectual property rights are reserved by the providers and/or the exchange providing the data contained in this website.
Fusion Media may be compensated by the advertisers that appear on the website, based on your interaction with the advertisements or advertisers.
© 2007-2026 - Fusion Media Limited. All Rights Reserved.