RWE AG ST O.N. (RWEG)

Real-time derived
Currency in EUR
35.590
+0.360(+1.02%)
Closed·
RWEG Scorecard
Full Analysis
Trading at a low earnings multiple
Trading near 52-week High
Fair Value
Day's Range
35.40035.900
52 wk Range
27.76035.900
Key Statistics
Edit
Prev. Close
35.59
Open
35.68
Day's Range
35.4-35.9
52 wk Range
27.76-35.9
Volume
3.53M
Average Volume (3m)
2.82M
1-Year Change
7.33%
Book Value / Share
45.46
Fair Value
unlockUnlock
Fair Value Upside
unlockUnlock
RWEG Scorecardpro icon
Company’s Health
Unlock
Fair Value
Unlock Price
Fair Price
Upside
Price Target
42.350
Upside
+18.99%
Members' Sentiments
Bearish
Bullish
ProTips
Net income is expected to drop this year

RWE AG ST O.N. News & Analysis

Show more

RWE AG ST O.N. Company Profile

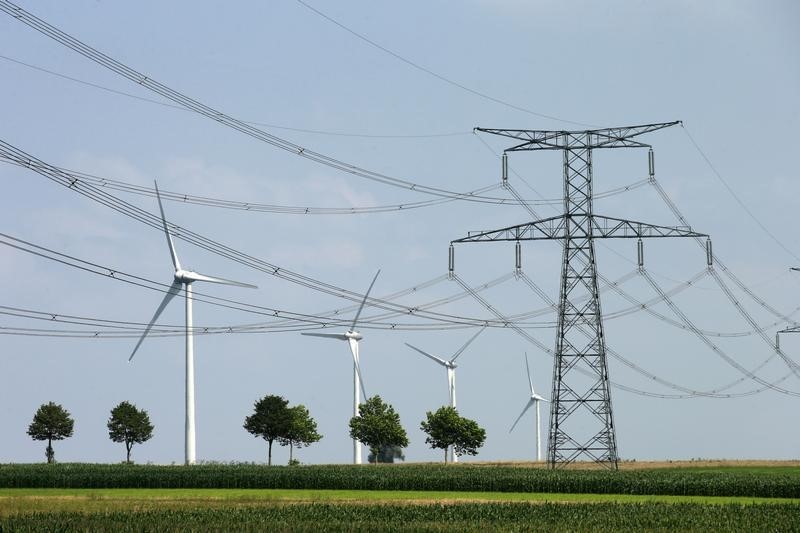
RWE Aktiengesellschaft generates and supplies electricity from renewable and conventional sources in Germany, the United Kingdom, rest of Europe, North America, and internationally. The company operates through five segments: Offshore Wind; Onshore Wind/Solar; Flexible Generation; Supply & Trading; and Phaseout Technologies. It generates wind, hydro, solar, gas, lignite, and biomass electricity. The company also trades in electricity, gas, and energy commodities; operates gas storage facilities; and engages in battery storage activities, as well as lignite mining and refining. It serves commercial, industrial, and municipal customers. The company was founded in 1898 and is headquartered in Essen, Germany.

Sector
Utilities
Employees
20805
Market
Germany

Compare RWEG to Peers and Sector

Metrics to compare
RWEG
Peers
Sector
Relationship
P/E Ratio
6.6x13.0x12.0x
PEG Ratio
0.06−0.030.02
Price/Book
0.8x1.1x1.3x
Price / LTM Sales
1.2x1.9x1.5x
Upside (Analyst Target)
18.0%146.2%13.6%
Fair Value Upside
Unlock14.1%4.8%Unlock

Analyst Ratings

16 Buy
2 Hold
0 Sell
Ratings:
18 analysts
Overall Consensus
Buy

Analysts 12-Month Price Target:

Average 42.350
(+18.99% Upside)

Dividends

Payout Ratio
Payout ratio (TTM)
Earnings retained
EPS 5.33%
Dividend Yield
3.09%
Industry Median 2.89%
Annualised payout
1.10
Paid annually
5-Years Growth
+6.58%
Growth Streak

Earnings

Latest Release
May 15, 2025
EPS / Forecast
0.68 / --
Revenue / Forecast
5.70B / --
EPS Revisions
Last 90 days

RWEG Income Statement

People Also Watch

15.485
EONGn
-0.29%
8.396
TKAG
-0.19%
242.00
ESLX
-1.91%
22.10
DHER
-2.00%
267.900
DB1Gn
-1.51%

FAQ

What Is the RWE AG ST (RWEG) Stock Price Today?

The RWE AG ST stock price today is 35.59

What Stock Exchange Does RWE AG ST Trade On?

RWE AG ST is listed and trades on the Frankfurt Stock Exchange stock exchange.

What Is the Stock Symbol for RWE AG ST?

The stock symbol for RWE AG ST is "RWEG."

Does RWE AG ST Pay Dividends? What’s The Current Dividend Yield?

The RWE AG ST dividend yield is 3.09%.

What Is the RWE AG ST Market Cap?

As of today, RWE AG ST market cap is 25.97B.

What Is RWE AG ST's Earnings Per Share (TTM)?

The RWE AG ST EPS (TTM) is 5.33.

When Is the Next RWE AG ST Earnings Date?

RWE AG ST will release its next earnings report on 13 Aug 2025.

From a Technical Analysis Perspective, Is RWEG a Buy or Sell?

Based on moving averages and other technical indicators, the daily buy/sell signal is Strong Buy.

How Many Times Has RWE AG ST Stock Split?

RWE AG ST has split 2 times.

How Many Employees Does RWE AG ST Have?

RWE AG ST has 20805 employees.

What is the current trading status of RWE AG ST (RWEG)?

As of 15 June 2025, RWE AG ST (RWEG) is trading at a price of 35.59, with a previous close of 35.59. The stock has fluctuated within a day range of 35.40 to 35.90, while its 52-week range spans from 27.76 to 35.90.
Risk Disclosure: Trading in financial instruments and/or cryptocurrencies involves high risks including the risk of losing some, or all, of your investment amount, and may not be suitable for all investors. Prices of cryptocurrencies are extremely volatile and may be affected by external factors such as financial, regulatory or political events. Trading on margin increases the financial risks.
Before deciding to trade in financial instrument or cryptocurrencies you should be fully informed of the risks and costs associated with trading the financial markets, carefully consider your investment objectives, level of experience, and risk appetite, and seek professional advice where needed.
Fusion Media would like to remind you that the data contained in this website is not necessarily real-time nor accurate. The data and prices on the website are not necessarily provided by any market or exchange, but may be provided by market makers, and so prices may not be accurate and may differ from the actual price at any given market, meaning prices are indicative and not appropriate for trading purposes. Fusion Media and any provider of the data contained in this website will not accept liability for any loss or damage as a result of your trading, or your reliance on the information contained within this website.
It is prohibited to use, store, reproduce, display, modify, transmit or distribute the data contained in this website without the explicit prior written permission of Fusion Media and/or the data provider. All intellectual property rights are reserved by the providers and/or the exchange providing the data contained in this website.
Fusion Media may be compensated by the advertisers that appear on the website, based on your interaction with the advertisements or advertisers.
© 2007-2025 - Fusion Media Limited. All Rights Reserved.