Elecnor SA (ENOR)

Currency in EUR
37.550
+0.150(+0.40%)
Delayed Data·
Earnings results expected in 8 days
High dividend Yield
ENOR is not included in our AI-picked strategies. See which stocks are.
Fair Value
Day's Range
36.65037.650
52 wk Range
18.54038.000
Key Statistics
Bid/Ask
37.50 / 37.60
Prev. Close
37.4
Open
37.55
Day's Range
36.65-37.65
52 wk Range
18.54-38
Volume
38.94K
Average Volume (3m)
103.27K
1-Year Change
108.0574%
Fair Value
unlockUnlock
Fair Value Upside
unlockUnlock
ENOR Scorecardpro icon
Company’s Health
Unlock
Fair Value
Unlock Price
Fair Price
Upside
Price Target
31.450
Downside
-16.25%
Members' Sentiments
Bearish
Bullish
ProTips
Impressive gross profit margins

Elecnor SA News & Analysis

Show more

Technical Analysis

Summary
Strong Sell
Sell
Neutral
Buy
Strong Buy
Strong Buy
Technical Indicators
Buy
Moving Averages
Strong Buy

Analyst Ratings

1 Buy
2 Hold
0 Sell
Ratings:
3 analysts
Overall Consensus
Buy

Analysts 12-Month Price Target:

Average 31.450
(-16.25% Downside)
Firm
ArticlePositionPrice TargetUpside / DownsideFrom Price TargetActionDate

Earnings

Latest Release
26/02/2026
EPS / Forecast
1.00 / --
Revenue / Forecast
1.24B / --
EPS Revisions
Last 90 days

Dividends

Payout Ratio
Payout ratio (TTM)
Earnings retained
EPS 1.31%
Dividend Yield
7.05%
Industry Median 2.17%
Annualised payout
2.61
Paid unevenly
5-Years Growth
+63.88%
Growth Streak

ENOR Income Statement

Compare ENOR to Peers and Sector

Metrics to compare
ENOR
Peers
Sector
Relationship
P/E Ratio
28.6x25.2x12.7x
PEG Ratio
−0.34−0.350.03
Price/Book
3.4x2.3x1.4x
Price / LTM Sales
0.7x1.6x1.3x
Upside (Analyst Target)
−13.1%−4.8%20.1%
Fair Value Upside
Unlock−7.7%5.7%Unlock

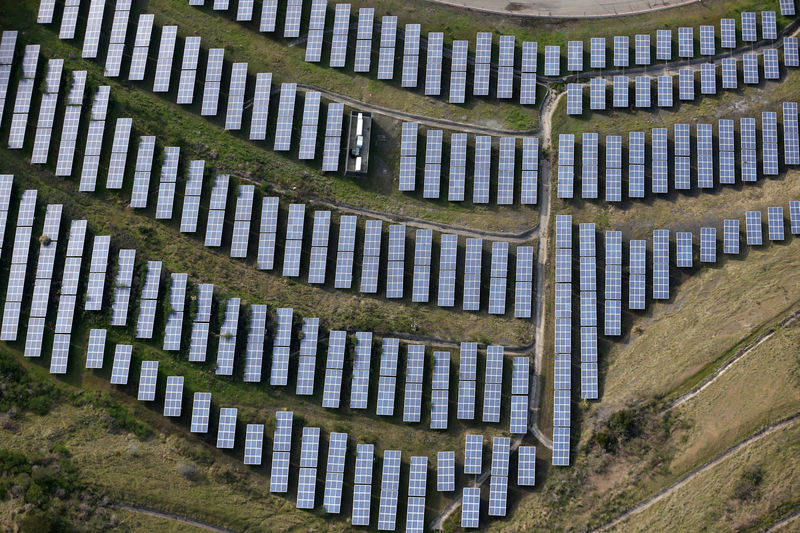
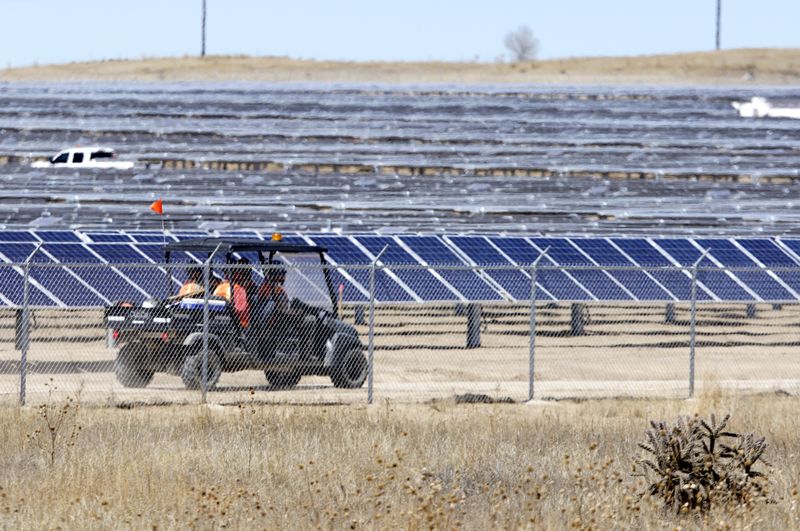
Elecnor, S.A. engages in the development, construction, and operation of projects and services in Spain and internationally. It operates through three segments: Services, Projects, and Concessions and Own Projects. The company offers electricity distribution, telecommunications, and infrastructure maintenance; construction, operation, and maintenance of energy generation and transmission infrastructure; and promotion, financing, investment, and management of energy transmission and generation assets. It also provides electricity, power generation, maintenance, efficiency energy, telecommunications and systems, railways, gas, facilities, construction, water, environment, and natural resource activities. In addition, the company offers distribution and transmission networks, substations, transformer stations, and live-line work; public lighting; wind farms, solar photovoltaics, power generation plants, and self-consumption; catenary, traction substations, signaling, and interlocking, and communications; construction and rehabilitation of non-residential buildings; electricity and instrumentation, air conditioning, fire protection, ventilation, automation and control, plumbing and sanitation, security, public address and sound, and comprehensive installations; hydraulic works, water treatment plants, and environmental works. Elecnor, S.A. was incorporated in 1958 and is based in Madrid, Spain. Elecnor, S.A. operates as a subsidiary of Cantiles XXI, S.L.

Employees
24640
Market
Spain

Ownership

Ownership Overview

Type
Common Stock Held% of Shares OutstandingMarket Value
Mutual Funds & ETFs
7.79M9.20%291.28M
Other Institutional Investors
46.36M54.74%1.73B
Public Companies & Retail Investors
30.54M36.06%1.14B
Total
84.7M100.00%3.17B

Top Holders

Holder
% of holding
Shares Held
Date Reported
Value (In 1,000s)
Cantiles XXI, S.L.54.19%45,900,3301,716,672
Santander Asset Management SA SGIIC2.29%1,938,75072,509

People Also Watch

3.480
EDRE
+3.42%
17.035
ENAG
+0.62%
2.865
TUBA
-1.55%
16.62
HOME
+0.73%
48.835
IDR
-0.21%

FAQ

What Is the Elecnor (ENOR) Stock Price Today?

The Elecnor stock price today is 37.550 EUR.

What Stock Exchange Does Elecnor Trade On?

Elecnor is listed and trades on the Madrid Stock Exchange.

What Is the Stock Symbol for Elecnor?

The stock symbol for Elecnor is "ENOR."

Does Elecnor Pay Dividends? What’s The Current Dividend Yield?

The Elecnor dividend yield is 7.05%.

What Is the Elecnor Market Cap?

As of today, Elecnor market cap is 3.170B EUR.

What Is Elecnor's Earnings Per Share (TTM)?

The Elecnor EPS (TTM) is 1.307.

When Is the Next Elecnor Earnings Date?

Elecnor will release its next earnings report on 08/05/2026.

From a Technical Analysis Perspective, Is ENOR a Buy or Sell?

Based on moving averages and other technical indicators, the daily buy/sell signal is Strong Buy.

How Many Times Has Elecnor Stock Split?

Elecnor has split 3 times.

How Many Employees Does Elecnor Have?

Elecnor has 24640 employees.

What is the current trading status of Elecnor (ENOR)?

As of 30/04/2026, Elecnor (ENOR) is trading at a price of 37.550 EUR, with a previous close of 37.400 EUR. The stock has fluctuated within a day range of 36.650 EUR to 37.650 EUR, while its 52-week range spans from 18.540 EUR to 38.000 EUR.

What Is Elecnor (ENOR) Price Target According to Analysts?

The average 12-month price target for Elecnor is 31.450 EUR, with a high estimate of 34.95 EUR and a low estimate of 26.9 EUR. 1 analysts recommend buying the stock, while 0 suggest selling, leading to an overall rating of Buy. The stock has an -16.25% Downside potential.
Risk Disclosure: Trading in financial instruments and/or cryptocurrencies involves high risks including the risk of losing some, or all, of your investment amount, and may not be suitable for all investors. Prices of cryptocurrencies are extremely volatile and may be affected by external factors such as financial, regulatory or political events. Trading on margin increases the financial risks.
Before deciding to trade in financial instrument or cryptocurrencies you should be fully informed of the risks and costs associated with trading the financial markets, carefully consider your investment objectives, level of experience, and risk appetite, and seek professional advice where needed.
Fusion Media would like to remind you that the data contained in this website is not necessarily real-time nor accurate. The data and prices on the website are not necessarily provided by any market or exchange, but may be provided by market makers, and so prices may not be accurate and may differ from the actual price at any given market, meaning prices are indicative and not appropriate for trading purposes. Fusion Media and any provider of the data contained in this website will not accept liability for any loss or damage as a result of your trading, or your reliance on the information contained within this website.
It is prohibited to use, store, reproduce, display, modify, transmit or distribute the data contained in this website without the explicit prior written permission of Fusion Media and/or the data provider. All intellectual property rights are reserved by the providers and/or the exchange providing the data contained in this website.
Fusion Media may be compensated by the advertisers that appear on the website, based on your interaction with the advertisements or advertisers.
© 2007-2026 - Fusion Media Limited. All Rights Reserved.