Last night saw a little bit of downside volatility return to equity markets but it was all marginal as the huge gains from Friday night’s sessions across both sides of the Atlantic couldn’t be sustained. Keeping risk sentiment elevated was a strong US durable goods order for May, although the USD pulled back against most of the undollars, although it did lift against Yen slightly as the commodity currencies went nearly nowhere with the Australian dollar still anchored at the 69 handle. Bond markets saw another slight lift in yields, with 10 Year Treasuries pushed back up to the 3.2% while interest rate futures lifted slightly to indicate 185 bps in rate rises by the Fed this year – still down from well over 200bps a few weeks ago. Commodity prices were mixed again, with oil prices lifting more than 2% after trying to stabilise on Friday night, while gold rose was again under pressure to fall back below the $1830USD per ounce level.
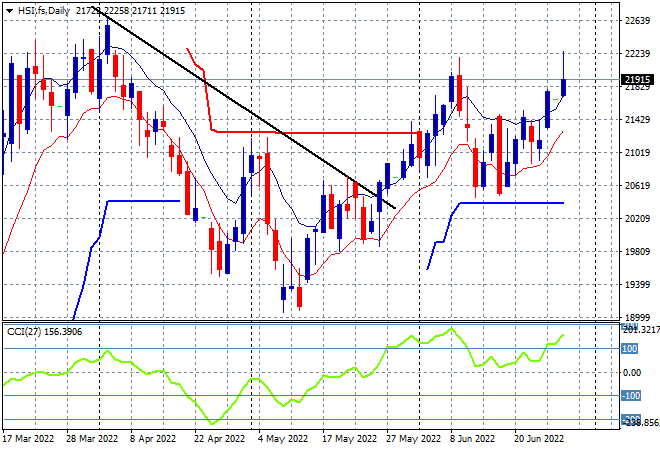
Looking at share markets in Asia from yesterday’s session, where mainland Chinese share markets again pushed higher into the close with the Shanghai Composite up more than 0.8% to 3378 points while the Hang Seng Index has lifted more than 2%, closing at 22219 points. The daily chart was showing price anchored around the high moving average area but not yet pushing through as momentum remained positive but not overbought so this move swiftly out the blocks confirms Friday’s price action as a proper breakout. I’m a bit concerned with the overhead tail on yesterday’s candle that matches the previous false breakout top at the 22000 point level however:
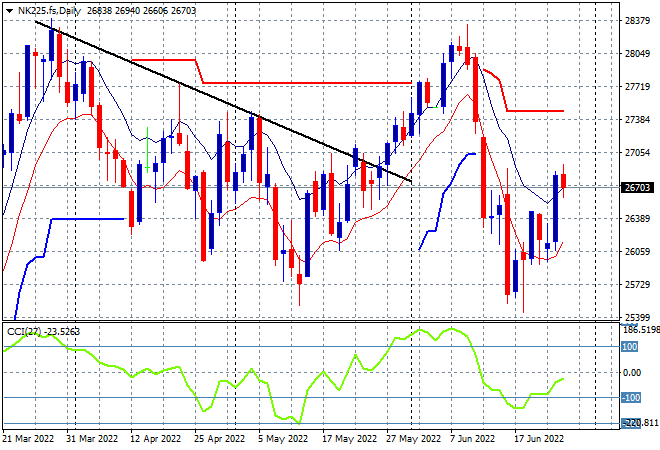
Japanese stock markets also did very well, with the Nikkei 225 index closing more than 1.4% higher at 26871 points. The daily futures chart of the Nikkei 225 shows a very solid start to the trading week even as volatility in Yen abates. Another market with a crossover above the high moving average which would normally indicate a bottoming action, but so far the technical picture is a swing play only with daily momentum still negative but now out of the oversold zone. Watch for a follow through here above the high moving average to confirm:
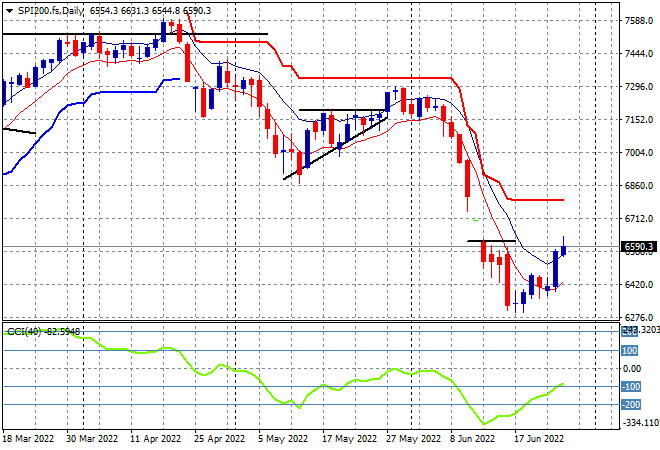
Australian stocks put in some very solid gains with the ASX200 finishing nearly 2% higher, closing at 6705 points. SPI futures are relatively flat given the pullback on Wall Street, so we’re likely to see a pause here. The daily chart is still not a pretty picture with my contention of price needing to recover well above the 6600 point level before calling any bottoming action still holding, as daily momentum reverts away from the very oversold zone but is still quite negative:
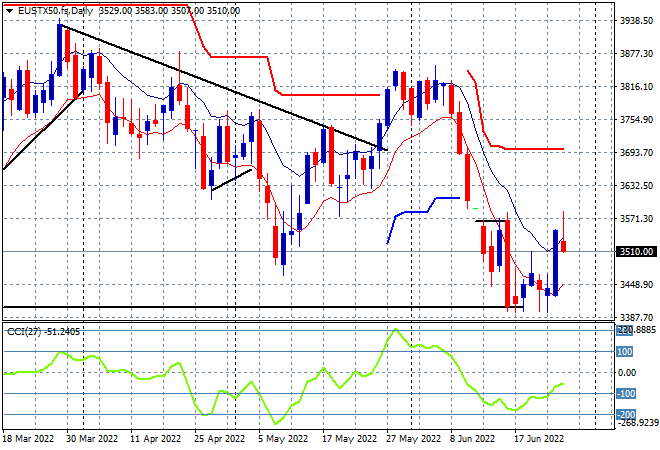
European stocks were a bit wobbly out the gate after stonking sessions on Friday night, with the Eurostoxx 50 index eventually closing just 0.2% higher at 3538 points. The daily chart picture remains in somewhat of a bearish states here with price action still around the the March dip lows as this classic swing action shows daily momentum crossing over from its oversold position. But, this requires a proper confirmation above the high moving average with price needing to get back well above the 3570 point area that was resistance for the last couple of weeks:
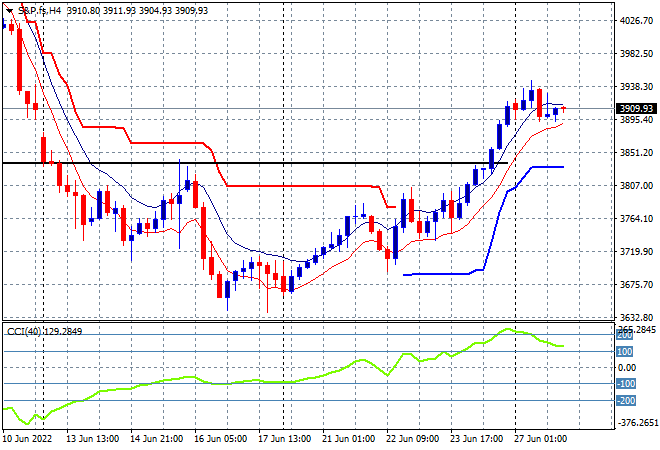
Wall Street saw some mild pullbacks with the NASDAQ losing 0.7% while the S&P500 closed exactly at 3900 points, losing 0.3% in the process. The four hourly chart shows a similar picture to European stocks, with the nascent signs building of a bottom forming below the March lows requiring a fill above that lower horizontal black line which is now blown through on Friday night’s action. As I said previously, a recovery out of this correction requires a rally back through the psychologically important 4000 point zone -so don’t get too excited just yet:
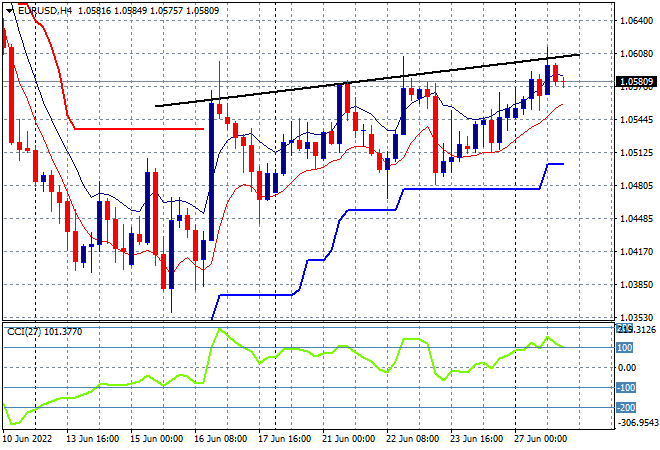
Currency markets were somewhat contained again, with the USD pulling back but mainly only against Euro with the union currency lifting higher again, but only just making a new weekly high as it pushed up towards the 1.05 handle. The four hourly chart shows a bullish bias to this overall sideways move as short term momentum picks up but its all relative given the outsized rate hikes still expected by the Fed compared to the ECB rate rises. I’d watch trailing ATR support at the 1.05 level here carefully but also any upside move beyond last week’s intrasession high:
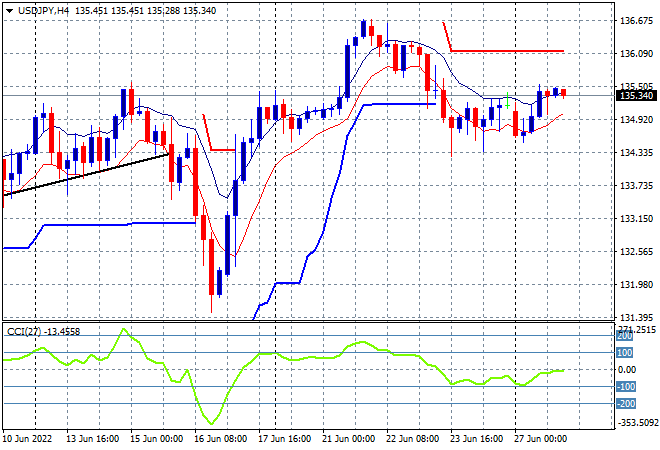
The USDJPY pair was able to lift slightly after being down for the count on Friday night, maintaining a position just above the 135 area overnight but not able to progress back to the 136 handle. This keep price just below the trailing ATR support level as the uncle point that must hold here or we could get a repeat of the previous week’s dump. Watch for four hourly momentum if it crosses below into a very oversold level:
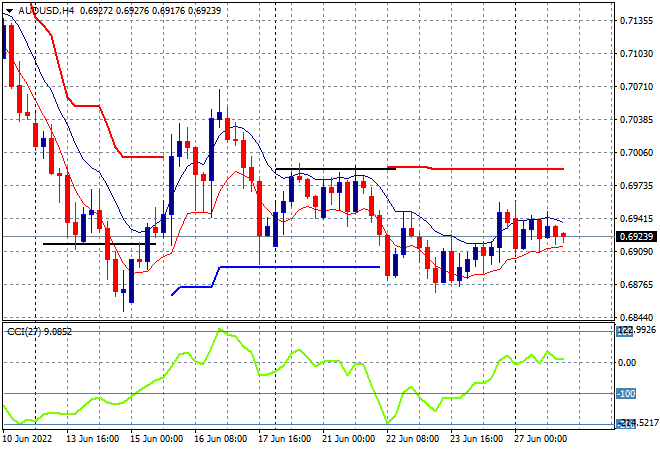
The Australian dollar is also still contained here just above the 69 cent level, with a battle underway here as sellers want to get it back down to the previous weekly low at the mid 68 level. My contention of a further retracement below the 69 handle still holds as the Fed well remains ahead of the hapless boffins at Martin Place, but with four hourly momentum now positive, watch for a short term swing play here above the high moving average:
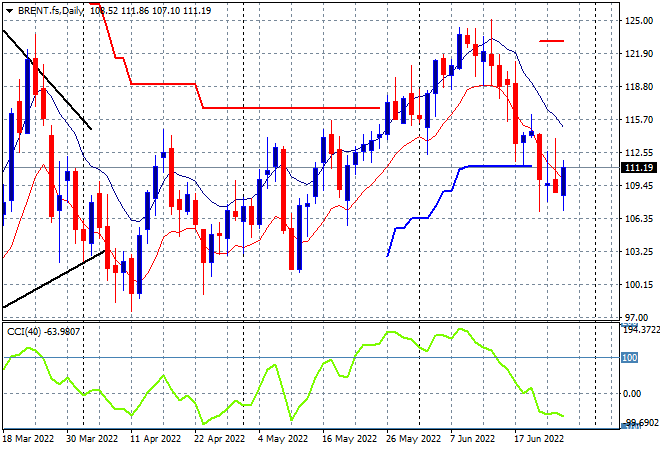
Oil markets are trying to stabilise after a series of lower lows that saw Brent crude pushed well below the $108USD per barrel level last week with a small rally overnight taking it back above the $111 level instead. Daily momentum is still quite negative however, with price no longer supported at the $115 area having crossed below ATR trailing support level as well. This could turn into a push down to the $100 psychological support level next, so watch the previous daily session lows at the $107 area to crack:
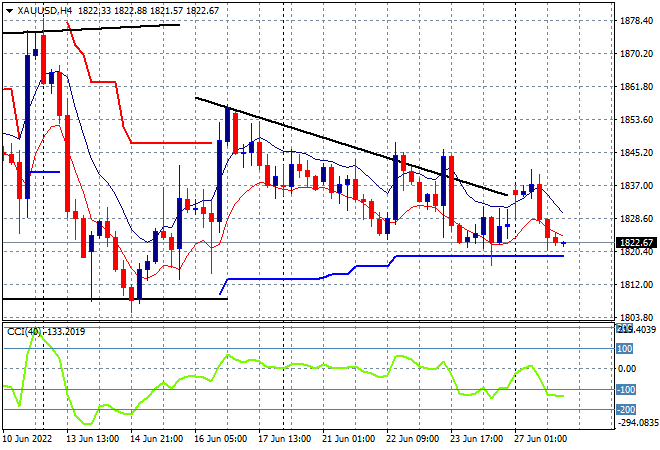
Gold still can’t get out of its sideways bearish oscillation with another unsteady session seeing it pushed right down to the $1820USD per ounce level as resistance firms quite strongly overhead at the $1850USD per ounce level. Daily momentum remains negative as four hourly momentum rolls back into the oversold zone, with the short term trend showing a series of lower low sessions, so watch for a breakdown shortly: