Friday night saw more volatility return to equity markets but it was all the good kind with a possible bottom to all this mess forming after some better talk-talk from Fed Chair Powell during the week. Wall Street gained more than 3% across the board, while the USD pulled back against most of the undollars, holding Yen in check but commodity currencies finally found some life with the Australian dollar bouncing back above the 69 handle. Bond markets saw a slight lift in yields, with 10 Year Treasuries pushed back up to the 3.1% while interest rate futures came back slightly further to only indicate 180 bps in rate rises by the Fed this year – down from well over 200bps a few weeks ago. Commodity prices were mixed again, with oil prices trying to stabilise while gold rose slightly to hold well well below the $1830USD per ounce level.
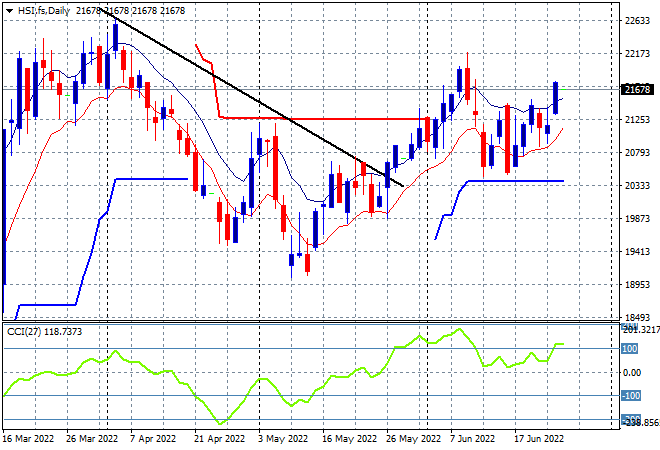
Looking at share markets in Asia from Friday’s session, where mainland Chinese share markets again accelerated into the close with the Shanghai Composite closing more than 0.8% higher to 3349 points while the Hang Seng Index gained more than 2%, closing at 21719 points. The daily chart was showing price anchored around the high moving average area but not yet pushing through as momentum remained positive but not overbought. Friday’s price action looks like a proper breakout is underway but needs to clear the other false breakout high at the 22000 point level to call it proper:
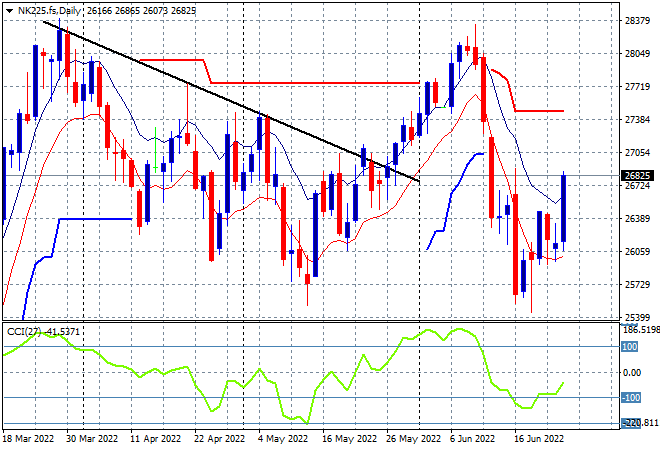
Japanese stock markets however are playing catchup after their previous scratch sessions with the Nikkei 225 index about to close more than 1.2% higher at 26501 points. The daily futures chart of the Nikkei 225 shows a very solid start to the trading week even as volatility in Yen abates. Another market with a crossover above the high moving average which would normally indicate a bottoming action, but so far the techincal picture is a swing play only with daily momentum still negative but now out of the oversold zone. Watch for a follow through here above the high moving average to confirm:
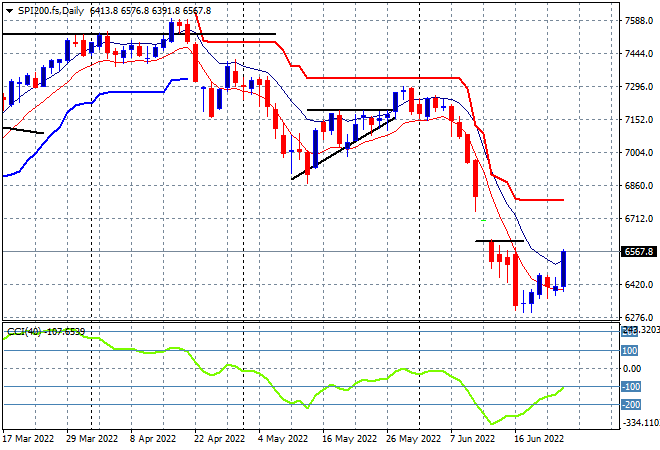
Australian stocks were able to put in modest gains, with the ASX200 about to finish nearly 0.8% higher at 6575 points. SPI futures are up more than 1.5% or over 100 points so we’re likely to see a very sold start to the week as the upside volatility on Wall Street gets everyone excited. The daily chart is still not a pretty picture with my contention of price needing to recover well above the 6600 point level before calling any bottoming action still holding, as daily momentum is still in the very oversold zone:
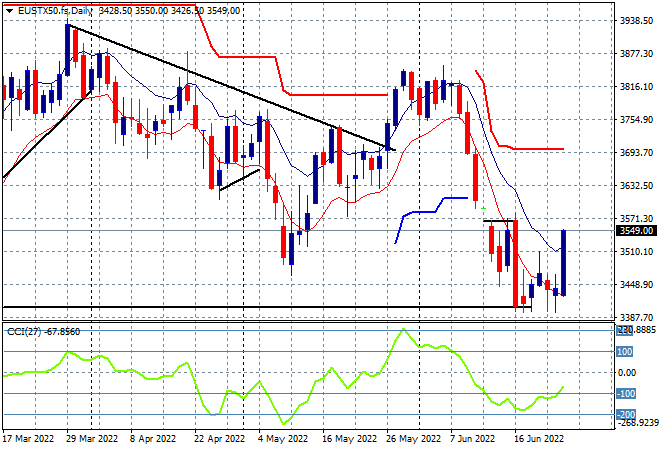
European stocks had great sessions prior to the US open but then accelerated as Wall Street shot out the gates with the Eurostoxx 50 index eventually closing 2.8% higher at 3533 points. The daily chart picture was looking very bearish here as price hovered right on the previous daily/weekly lows from the March dip but this gave the market a place to bounce off from as the classic swing pictures shows daily momentum crossing over from its oversold position. Again, this requires a proper confirmation above the high moving average with price needing to get back well above the 3570 point area that was resistance for the last couple of weeks:
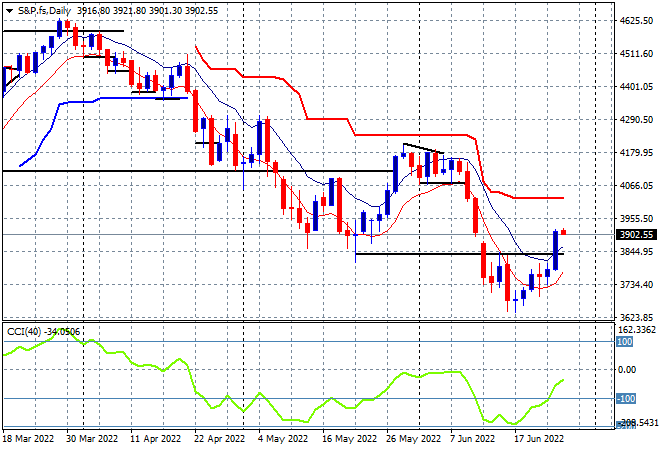
Wall Street was again volatile on Friday night with a reduction in inflation expectations helping confidence with the NASDAQ lifting 3.3% while the S&P500 closed exactly 3% higher at 3911 points. The daily chart shows a similar picture to European stocks, with the nascent signs building of a bottom forming below the March lows requiring a fill above that lower horizontal black line which is now blown through on Friday night’s action. As I said previously, a recovery out of this correction requires a rally that must go through the 3845 point area, and then back up through the psychologically important 4000 point zone – so we’re still another 100 points plus away before getting really excited:
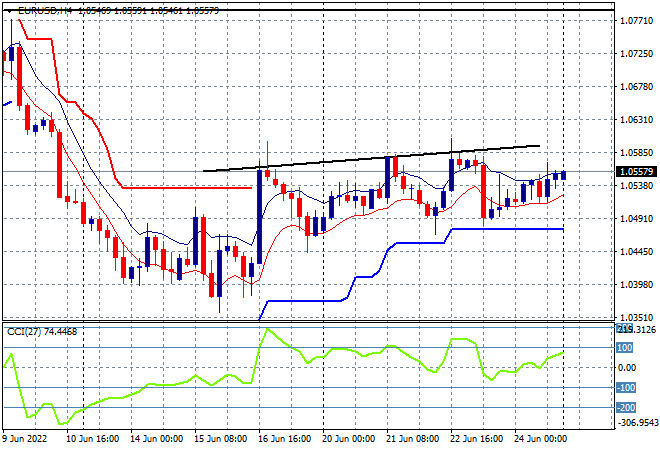
Currency markets were somewhat contained compared to their stock market cousins, with the USD pulling back slightly with Euro lifting higher, but only just making a new weekly high as it remains above the 1.05 handle. The four hourly chart shows a bullish bias to this overall sideways move as short term momentum picks up but its all relative given the outsized rate hikes still expected by the Fed compared to the ECB rate rises. I’d watch trailing ATR support at the 1.05 level here carefully but also any upside move beyond last week’s intrasession high:
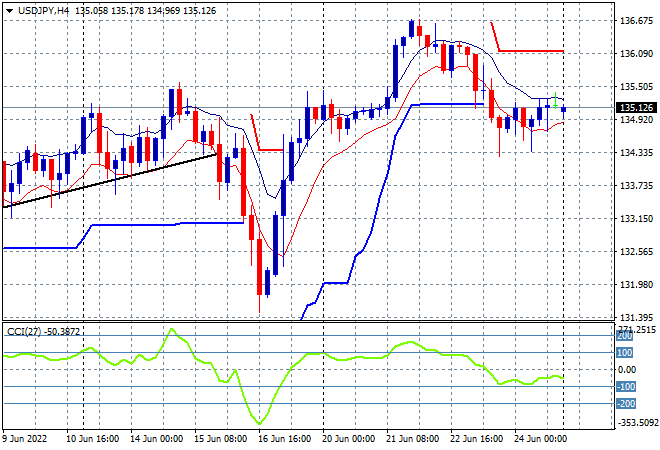
The USDJPY pair stayed down for the count on Friday night, maintaining a position just above the 135 area after failing to consolidate its recent big breakout above the 136 handle. This puts price just below the trailing ATR support level as the uncle point that must hold here or we could get a repeat of the previous week’s dump. Watch for four hourly momentum if it crosses below into a very oversold level:
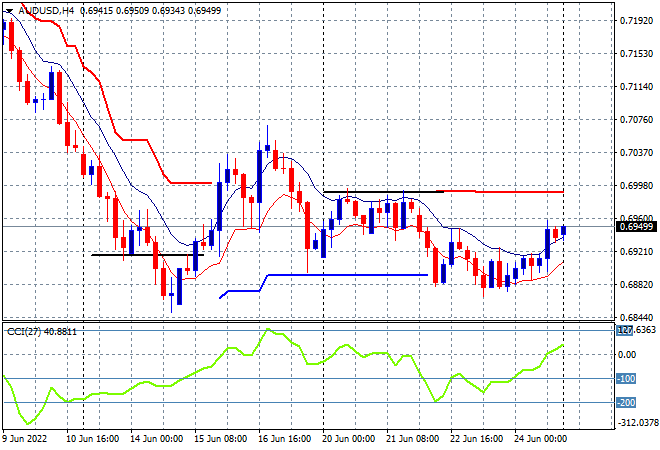
The Australian dollar had a late charge alongside equities on Friday night, with price action taking it back above the 69 cent level, as sellers could not get it back down to the previous weekly low at the mid 68 level. My contention of a further retracement below the 69 handle still holds as the Fed well remains ahead of the hapless boffins at Martin Place – with more confirmation on the weekend that Lowe doesn’t want to go in big steps from here on in – but as always watch for a swing play here above the high moving average:
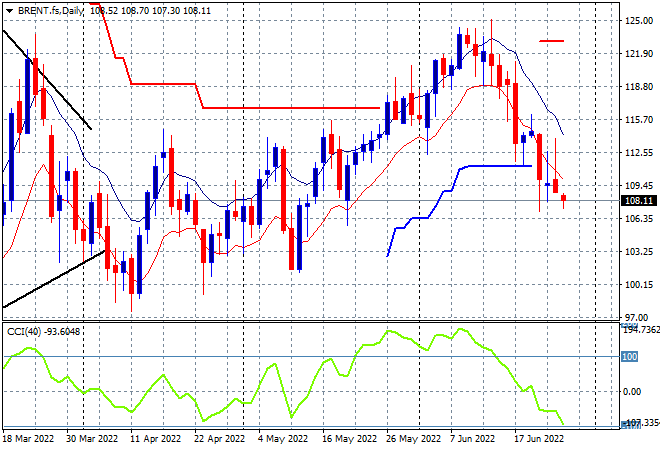
Oil markets are failing to stabilise after a series of lower lows that saw Brent crude now pushed down to the $108USD per barrel level, confirming its recent sharp inversion. Daily momentum has retraced fully from its overbought status with price no longer supported at the $115 area and has crossed below ATR trailing support level as well. This could turn into a push down to the $100 psychological support level next, and very swiftly:
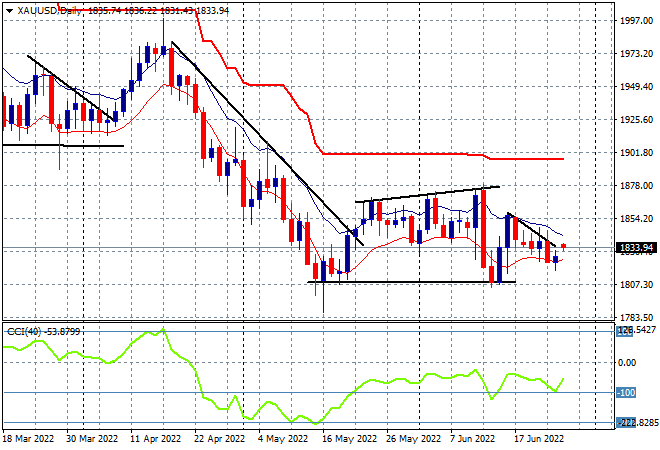
Gold still can’t get out of its sideways bearish oscillation with another unsteady session seeing it stabilize near the $1830USD per ounce level as resistance firms quite strongly overhead at the $1850USD per ounce level. Daily momentum remains negative as four hourly momentum rolls over into the oversold zone, with the short term trend is showing a series of lower low sessions, so its not yet enough to convince more buyers to step in: