Risk markets remained in sell mode on Friday night, with US domestic economic data still suggesting the Federal Reserve will be on the war path with more rate hikes. Stocks fell across both sides of the Atlantic and it looks like selling will continue here in Asia on the open. The USD was largely unchanged against Euro, which remains bang on parity, but rose slightly against the major currencies, with the Australian dollar still on the ropes. Bond markets had some mild volatility across the yield curve with 10 year Treasury yields lifting slightly to the 3.45% level with interest rate expectations still locking in a 75bps rise at the next Fed meeting. Crude oil closed basically unchanged with Brent stuck at the $92USD per barrel level while gold tried to stabilise after breaking sharply below the $1700USD per ounce level.
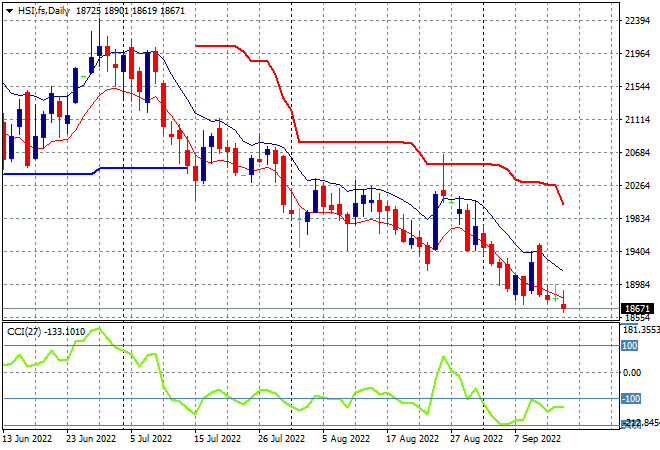
Looking at share markets in Asia from Friday’s session where Chinese share markets continued their mid week selloffs with the Shanghai Composite losing more than 2% to 3216 points while the Hang Seng Index slumped nearly 1% lower, closing at 18761 points. The daily futures chart was showing a bearish engulfing candle mid week which forecast this slump as it continues with a distinct lack of buying support. The bear market continues with daily momentum nowhere near out of its negative funk:
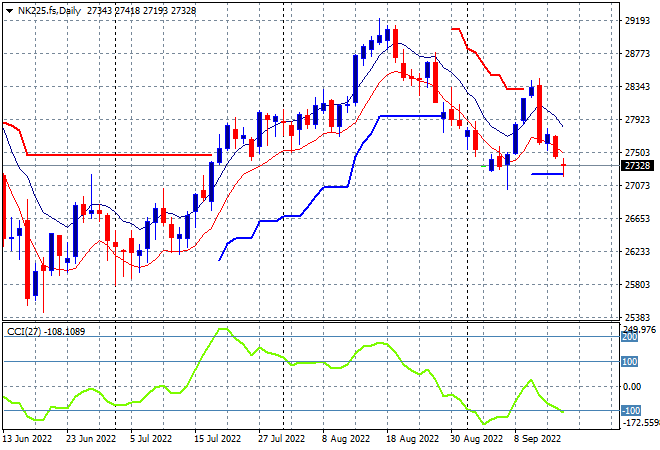
Japanese stock markets also joined in the selling fun, as the Nikkei 225 closed 1.1% lower at 27567 points. The daily chart shows this significant slump in another bearish engulfing candle wiping out all the gains of the previous trading week. Daily momentum remains negative and nearly oversold so watch for some support to be tested at the recent daily low sessions around the 27500 point level:
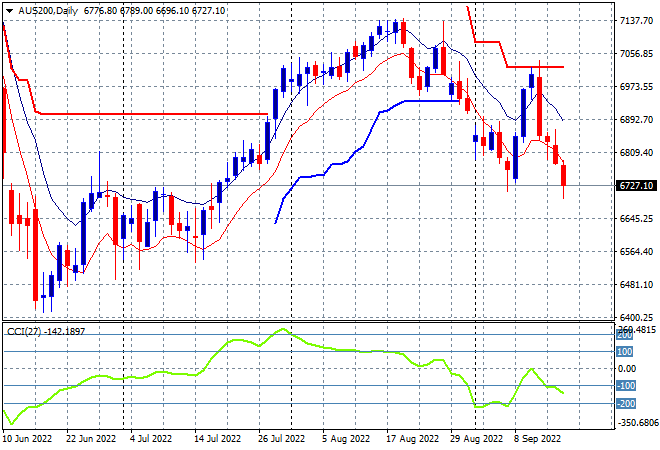
Australian stocks were also hit hard on the open and stayed down, with the ASX200 finishing 1.5% lower at 6739 points. SPI futures are indicating further falls on the open in line with Wall Street’s falls on Friday night. The daily chart has similar price action to other Asia stock markets, with price now below the August lows as daily momentum has switched to full oversold mode. This looks precarious and a test of key support at the 6700 point level is critical next:
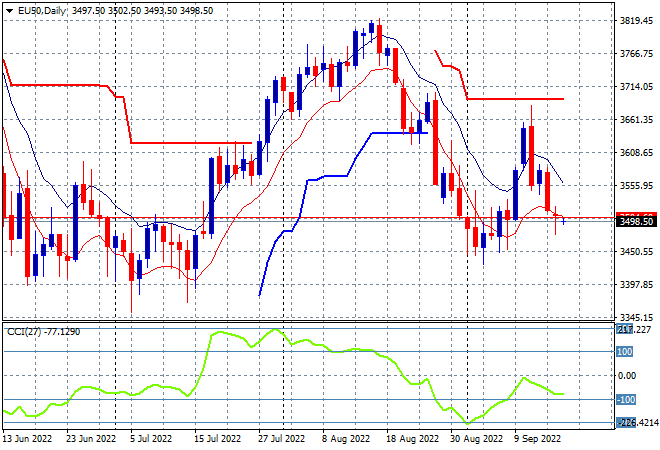
European stocks were red across the board with the Eurostoxx 50 Index finishing more than 1% lower, closing exactly at 3500 points. The daily chart was looking a lot like a dead cat bounce, following the moves off the June lows at the 3300 level that look like the next target to reach. Another bearish engulfing candle and a failure of daily momentum to get back above positive readings suggesting another leg down:
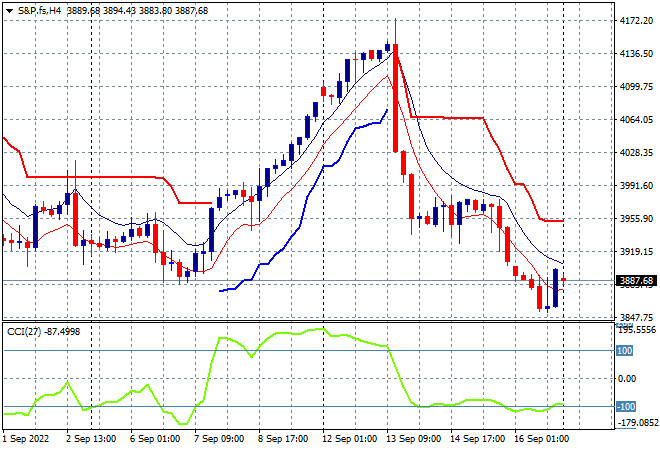
Wall Street just can’t find any confidence in the wake of more Fed rate hikes, with the NASDAQ off by more than 0.9% while the S&P500 finished 0.7% lower at 3878 points. The four hourly chart is showing a break of price support at the 3900 point level, which is likely to turn into short term resistance instead as momentum remains sharply negative:
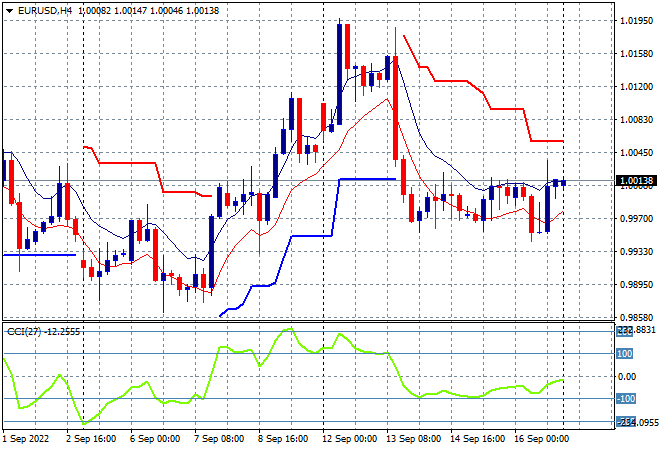
Currency markets calmed down again with the USD Index remaining steady due to Euro also largely unchanged as it dices with parity yet again. The union currency is likely to hover here until the next Fed meeting as I still contend that parity is actually permanent resistance. Momentum is not yet oversold on the four hourly chart which indicates selling pressure hasn’t re-engaged yet:
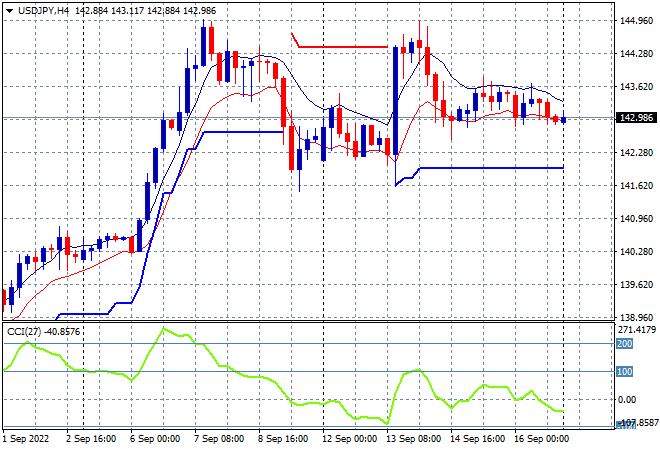
The USDJPY pair is in a similar position but with some mild deceleration on Friday night following the bounce up to the previous weekly highs at the 145 handle, finishing just below the 143 level. Short term momentum has switched from neutral to slightly negative, but price action in the short term is holding, so watch for any further moves below the low moving average at the 143 area:
The Australian dollar remains in its place with a very late yet mild bounceback in the Friday session pushing it back above the 67 handle. My contention that resistance is just too strong at all the previous levels with the 68 handle the area to beat in the short term, with price action now back on the lower trendline and weekly lows. Price action is likely to invert below the 67 handle again:
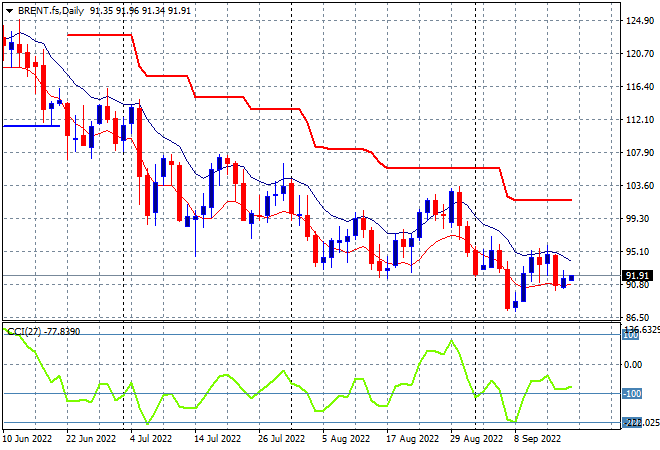
Oil markets are still chugging along on the bottom here, with the recent EIA survey not able to push Brent crude further higher, instead just stabilising to finish the trading week at just below the $92USD per barrel level. Daily momentum is still persistently negative although potentially swinging higher as price action wants to get off the floor here at the recent weekly lows, but its a very low probability trade:
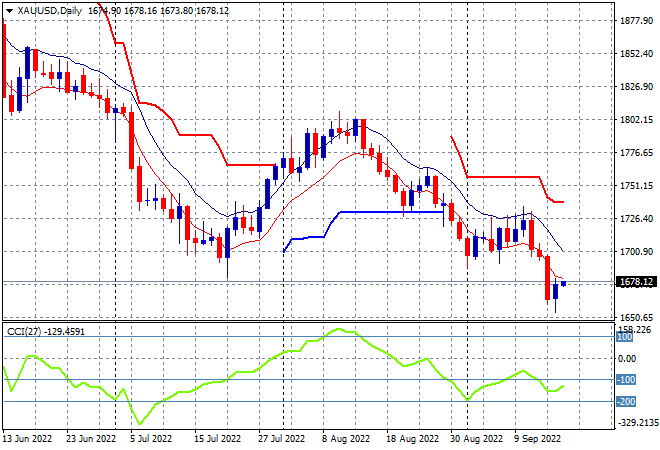
Gold like other undollars remained depressed on Friday night, with the mid week break below the key $1700USD per ounce support level sending the shiny metal sharply lower to finish the week at $1678USD per ounce. This is not a good look with this move sending gold back to the 2020 lows and closing up a monthly bearish setup :