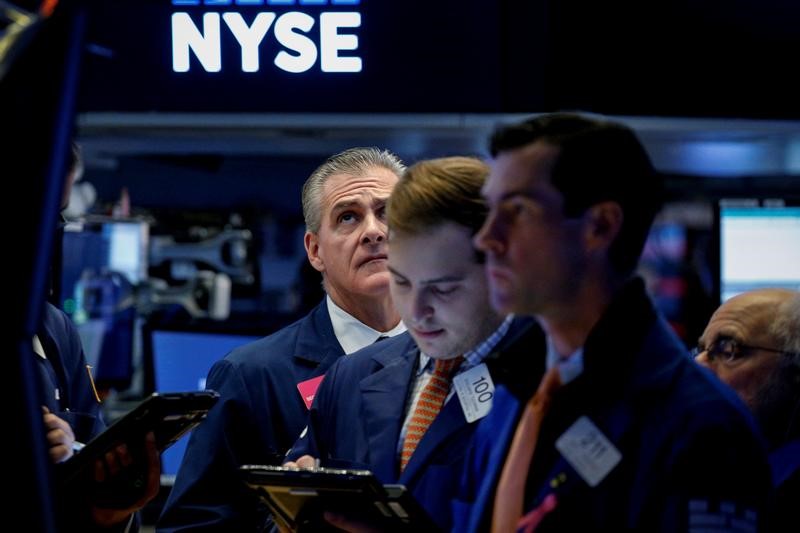
* S&P 500 recoups all of Thursday's loss
* Dollar on track for weekly loss (Updates prices, changes comment, dateline; previous LONDON)
By Rodrigo Campos
NEW YORK, April 23 (Reuters) - Stocks rose on Friday as Wall Street's drop the previous day on talk of an increase in U.S. capital gains taxes reversed, but a global stocks index was on track to post its first negative week in five.
Oil prices rose but were also negative for the week, while strong data lifted the euro and the dollar index fell as strong U.S. data took away from the safety bids.
Stocks rose nearly 1% on Wall Street a day after reports of a Biden Administration push to raise taxes on capital gains gave indexes a shakedown. The proposed numbers had been public since the presidential campaign.
"Yesterday was a knee-jerk reaction to the proposal. Right now, there's nothing definitive on the part of administration," said Robert Pavlik, senior portfolio manager at Dakota Wealth.
The Dow Jones Industrial Average .DJI rose 213.68 points, or 0.63%, to 34,029.58, the S&P 500 .SPX gained 43.36 points, or 1.05%, to 4,178.34 and the Nasdaq Composite .IXIC added 186.11 points, or 1.35%, to 14,004.52.
The pan-European STOXX 600 index .STOXX lost 0.13% and MSCI's gauge of stocks across the globe .MIWD00000PUS gained 0.76%.
Emerging market stocks rose 0.84%. MSCI's broadest index of Asia-Pacific shares outside Japan .MIAPJ0000PUS closed 0.83% higher, while Japan's Nikkei .N225 lost 0.57%.
IHS Markit's flash factory PMI for the United States hit 60.6 in the first half of the month, the highest reading on record back to 2007. In the euro zone, the Composite PMI rose to a nine-month high of 53.7, higher than anticipated. Anything above 50 indicates expansion.
Oil prices edged up with support from the economic data but concerns over demand from India and Japan lingered, putting a check on gains.
"Stronger PMIs across Europe, a weaker U.S. dollar, and some European countries planning to ease some of their restrictions are slightly supporting oil prices," UBS oil analyst Giovanni Staunovo said.
"Oil demand concerns in India due to rising COVID cases are capping the upside."
The euro rose after the strong data, up 0.45% to $1.2069.
The dollar index =USD fell 0.303%, with Sterling GBP= last trading at $1.3849, up 0.09% on the day. The Japanese yen weakened 0.02% versus the greenback at 107.96 per dollar.
Benchmark 10-year notes US10YT=RR last fell 2/32 in price to yield 1.563%, from 1.556% late on Thursday.
Spot gold XAU= dropped 0.4% to $1,776.25 an ounce. Silver XAG= fell 0.76% to $25.97.
Bitcoin BTC=BTSP last fell 3.53% to $49,857.18.
<^^^^^^^^^^^^^^^^^^^^^^^^^^^^^^^^^^^^^^^^^^^^^^^^^^^^^^^^^^^ Global assets
http://tmsnrt.rs/2jvdmXl Global currencies vs. dollar
http://tmsnrt.rs/2egbfVh Emerging markets
http://tmsnrt.rs/2ihRugV MSCI All Country Wolrd Index Market Cap
http://tmsnrt.rs/2EmTD6j
^^^^^^^^^^^^^^^^^^^^^^^^^^^^^^^^^^^^^^^^^^^^^^^^^^^^^^^^^^^>
