- 90-day US-Sino tariff hiatus, dovish Fed put stocks back on track
- But technicals suggest weakness
- Yields fall below 3% as traders price in a slower path to higher rates
- Dollar 0.3 percent away from 1.5-year high
All major US indices—the S&P 500, Dow Jones Industrial Average, NASDAQ Composite and Russell 2000—closed higher on Friday, capping the largest weekly gain for equities this year. The move was triggered by a variety of catalysts: continuing upbeat sentiment about the US economy, a dovish Fed, and hopes that this time there will finally be a trade breakthrough, as the presidents of the US and China met in Buenos Aires, on the sidelines of the weekend's G-20 gathering.
Investors pushed equities higher after last week's strong Black Friday and Cyber Monday activity indicated US consumers were still spending, thereby buoying the backbone of the American GDP. Midweek saw the first indication that Fed Chief Powell considers rates to be closer to neutral. This was a surprise given his remarks in early October which indicated the Fed Chair believed rates were a long way from neutral at that time.
Equities Outperform But Bearish Signals Remain

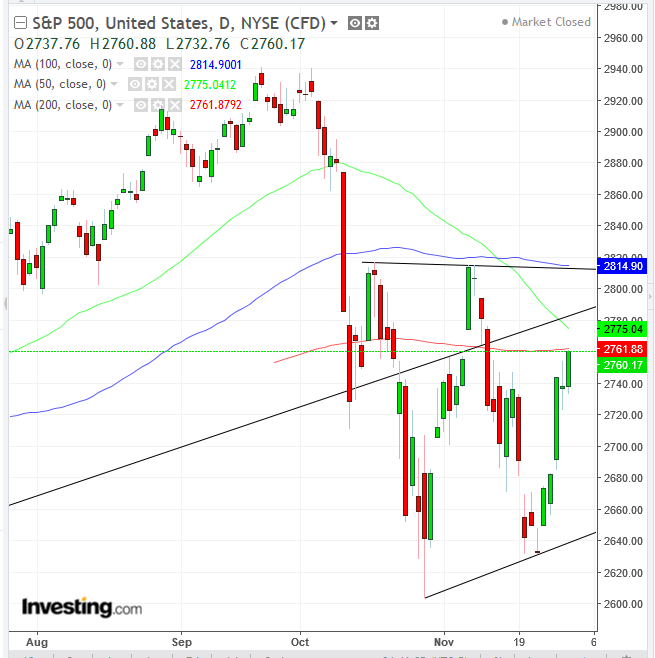
The S&P 500 rose 0.81 percent on Friday. However, defensive sector Utilities led the gains (+1.48%). Energy underperformed (-0.18%), dragged lower by oil’s brief dip below $50 on Friday, which pressured energy producers.
On a weekly basis, the S&P 500 leaped 4.85%, registering the biggest weekly gain for the benchmark since 2011. Health Care outperformed on a weekly basis (+6.95%), while Materials underperformed (+2.44%). Technically, the price of the index, much like peer US indices, closed near the height of the session, below the 200 DMA, as the falling 50 DMA threatened to post a Death Cross.
The fact that this technical dynamic is forming right beneath the broken uptrend line since the early 2016 bottom, doesn’t bode well for bulls. Also, the 100 DMA is 'guarding' the top of the consolidation since mid-October, adding downward pressure and increasing the probability of a downside breakout, below 2,640.
The Dow advanced almost 200 points on Friday, or 0.79 percent. On a weekly basis, the Dow gained 5.23 percent, its biggest boost for this time period. Technically, while the Dow has bounced back above its long-term uptrend line from the previous bottom, as well as the 200 DMA, the 50 DMA crossed below the 100 DMA. As well, the price may be forming a H&S continuation pattern, which would complete with a fall below 24,400.
The NASDAQ Composite also climbed 0.79 percent on Friday, gaining 5.64 percent for the week. Technically, the index posted a Death Cross last week, right above the top of a descending channel, suggesting prices would retest the primary uptrend line since the February 2016 bottom.
Microsoft (NASDAQ:MSFT) surged 7.6 percent for the week, closing at 110.89 on Friday, its biggest gain since 2015. Along with the notable jump for its stock, the software colossus capped the week by securing the title of the world's most valuable company by market cap, now valued at $851.22B. Since the tech giant is listed on the Dow, SPX and NASDAQ, it helped lift all those indices as well.
The Russell 2000 underperformed, advancing +0.47 percent. Its small cap domestic companies derive little to no benefit from any trade war settlement.

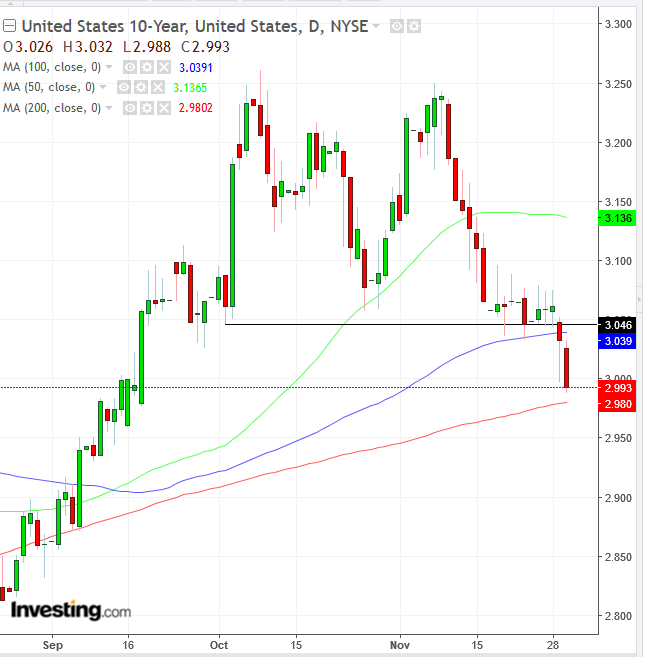
The yield on the 10-year Treasury note dropped below 3 percent. Technically, it completed a double-top, crossed below the 100 DMA but found support above the 200 DMA.

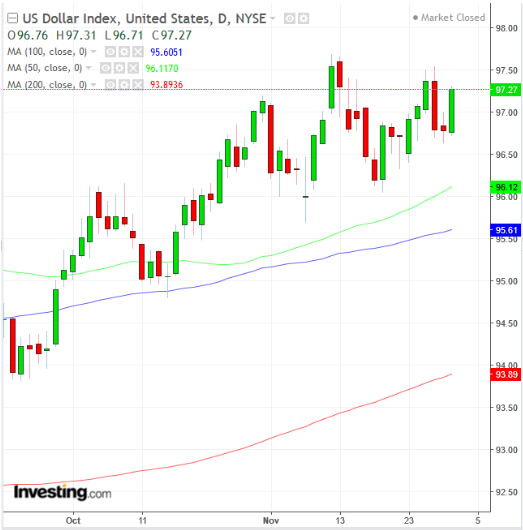
Increased foreign demand for Treasurys may have raised demand for the US dollar as well. The global reserve currency climbed 0.51 percent on Friday gaining a total of 0.3 percent since the November 12 close, the USD's highest point June 2017.
The euro weakened along with the regional shares after data showed inflation easing in the region.

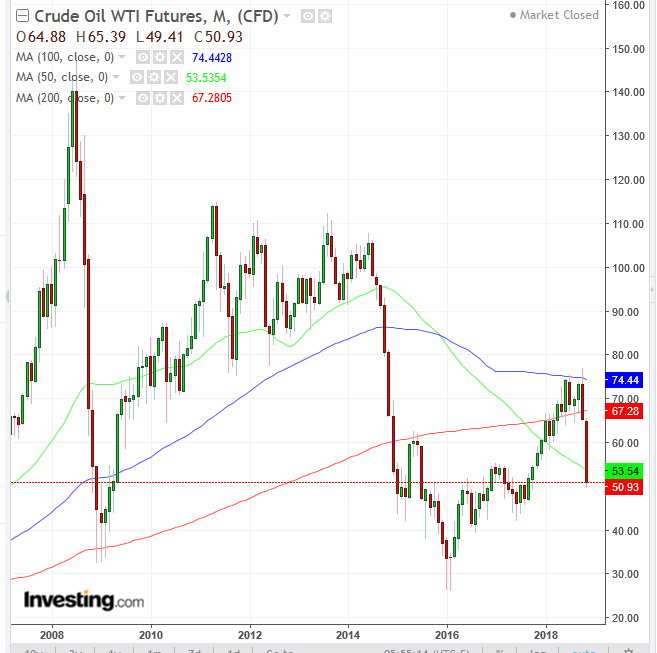
Oil finished the week marginally higher. However, it had its worst monthly decline since October 2008.
Bottom line: Macro fundamentals may look promising, but technical charts tell a different story. They reveal that bears are still in control.
Fundamentally, though US President Donald Trump and China's President Xi Jinping agreed to halt the imposition of any new tariffs for 90 days while they attempt a resolution, the risks are obvious. Even though a three month trade war ceasefire should potentially get stocks back on track, and within their previous uptrend, we'd argue that negotiations haven't necessarily been fruitful thus far.
As well, we believe that interest rates are the far larger issue. Since the Fed Chair seems to have turned dovish, suggesting a pause in upcoming rate hikes, it's become impossible to separate the macro issues and conclusively see how much each risk scares investors.
Our best guess? Stocks will trade within their previous consolidations for the next 90 days. Perhaps after that period is over we'll be able to ascertain some better answers.
Week Ahead
All times listed are EST
Sunday
20:45: China – Caixin Manufacturing PMI (November): forecast to stay at 50.1.
Monday
4:30: UK – Manufacturing PMI (November): forecast to rise to 51.6 from 51.1.
10:00: US – ISM Manufacturing PMI (November): expected to fall to 57.5 from 57.7.
22:30: Australia – RBA Rate Decision: no change in policy expected, with rates to remain at 1.5%.
Tuesday
4:30: UK – Construction PMI (November): index to fall to 52.5 from 53.2. Market to watch: GBP crosses
19:30: Australia – GDP (Q3): growth to slip to 3.3% from 3.4% YoY and 0.6% from 0.9% QoQ.
20:45: China – Caixin Services PMI (November): forecast to fall to 50.7 from 50.8,
Wednesday
4:30: UK – Services PMI (November): activity expected to increase, with the index rising to 52.5 from 52.2.
8:15: US – ADP Employment Report (November): 196K jobs expected to have been created, from 227K jobs a month ago.
10:00: Canada – BoC Rate Decision: no change in policy expected.
10:00: US – ISM Non-Manufacturing PMI (November): expected to drop to 59.2 from 60.3. Markets to watch: US indices, USD crosses
10:30: US – EIA Crude Inventories (w/e 30 November): stockpiles to rise to 0.769 million barrels from 3.577 million.
Thursday
8:30: US – Trade Balance (October): deficit to narrow to -$55.20 billion from $54 billion.
Friday
8:30: US – Nonfarm Payrolls (November): payrolls to be 200K from 250K, while average hourly earnings rise 03% from 0.2% MoM and remain steady at 3.1% YoY, and the unemployment rate holds at 3.7%.
8:30: Canada – Employment Change (November): 15,000 jobs expected to have been created, up from 11,200 a month earlier; unemployment rate to stay flat at 5.8%.
10:00: US – University of Michigan Consumer Sentiment (December, preliminary): forecast to be 97.1 from 97.5.
