- Three of the four major US indexes posted fresh records; Dow 2.5 percent from a record
- But renewed trade headwinds could weigh on markets
- However, a strong US economy would counter geopolitical risks for stocks.
- WTI jumps on looming Iran sanctions, Venezuela output problems, but pressured by stronger dollar
Though US stocks saw a sharp rally during the first half of last week on progress in the bilateral US-Mexico trade talks, markets trimmed weekly gains when it became clear that, with Canada excluded, this wasn't a NAFTA replacement. Further weighing on markets to end the week were reports that US President Donald Trump was calling for an additional $200 billion round of tariffs on Chinese imports. The key question investors must now answer is whether to rely on the optimism of weekly and even monthly advances—the S&P 500 locked in its fifth straight monthly gain while the Dow saw its second straight monthly jump—or instead to focus on the market's daily activity, which slipped lower as the week came to a close.
Stocks appear to be poised to continue their uptrend, but investors should be prepared for a potential pullback on geopolitical risk as well as signals from technical indicators. Ahead of the Labor Day holiday weekend, US stocks closed Friday mixed, on thin trading. The US and Canada were reportedly resuming trade talks this coming week, after having failed to produce a deal Friday.

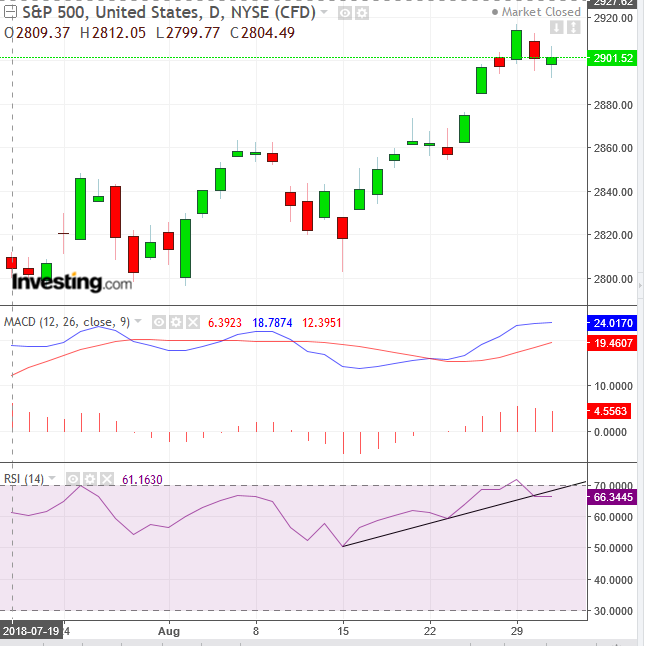
The S&P 500 advanced just 0.01 percent on Friday. Its weekly gain was 0.3 percent, to a record, but the various trade tensions pared an earlier 1.4 percent advance. The SPX closed 0.52 percent from its record high.
Technically, the S&P 500 trajectory is mirroring other major US indices. It's demonstrating that momentum is falling after a peak, suggesting a correction, within the uptrend, after the US market had arguably entered the most extended bull market in history.
The Dow Jones Industrial Average fell 0.09 percent on Friday and 0.68 percent for the week, trimming a 1.46 percent advance. The 30 component mega-cap index is now only 2.51 percent from its late-January record high.
The NASDAQ gained 0.26 percent on Friday, a mere 15-points below Wednesday’s record close, or 0.29 percent from Thursday’s all-time-high. This is the tech-heavy benchmark’s fifth monthly advance.
The Russell 2000 whose small-cap, generally domestic companies, outperformed given its position as the “anti-global-trade index,” jumping 0.48 Friday to a record close and an all-time high. The index also the leader among the major US indices on a weekly basis, gaining 0.87 percent. As well, last week capped its fifth straight weekly gain, as well as the sixth consecutive monthly gain.
Equity Uptrend Buoyed By Economic Growth?
The US economy remains on track for growth. The US GDP was revised to 4.2 percent from 4.1 percent. However, consensus opinion says this is the peak growth could taper out from here as the short-term stimulus from the US corporate tax cuts and a pickup in federal spending begin to wane. Overall, we expect the economy to grow by a solid 3% in 2018.
Two consumer-focused measures, both released last week, also reinforce our positive outlook for US equities. The Conference Board's Consumer Confidence Index reached the highest level since 2000, while the University of Michigan's Consumer Sentiment Index for August was revised higher than market expectations. The upshot is that consumers are responding favorably to a robust labor market and prospects for higher wages.
Consumer optimism is a crucial driver of our positive outlook for both stocks and the overall economy. That's because consumer spending represents the lion's share of economic activity, making up a whopping 70% of US GDP.
However, the housing market has continued to slow down. The Case-Shiller Price index climbed 6 percent YoY, the slowest pace in two years. Statistically, housing has proven to be a leading economic indicator, both in and out of recessions. However, unlike usual slowdowns within this sector, this one hasn't been brought on by withering demand but rather by supply interruptions, a sign of economic strength.
The Week Ahead
All times listed are EDT
Sunday
21:45: China – Caixin Manufacturing PMI (August): expected to fall to 50.7 from 50.8.
Monday
US markets closed for Labor Day Holiday
4:30: UK – Manufacturing PMI (August): expected to rise to 53.9 from 54.
Tuesday
1:30: Australia – RBA Rate Decision: expected to remain steady at 1.50 percent

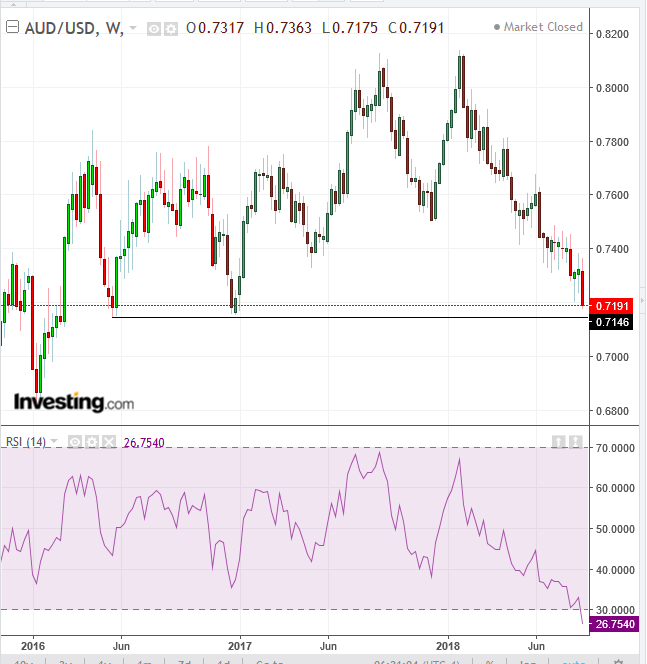
The Aussie dollar is threatening to fall below the 7.000 level, a support since May 2016. While the RSI is the most oversold since August 2015, it can keep falling when prices plunge more than double digits, as the AUD has been doing since the beginning of the year.
4:30: UK – Construction PMI (August): forecast to fall to 54.9 from 55.8.

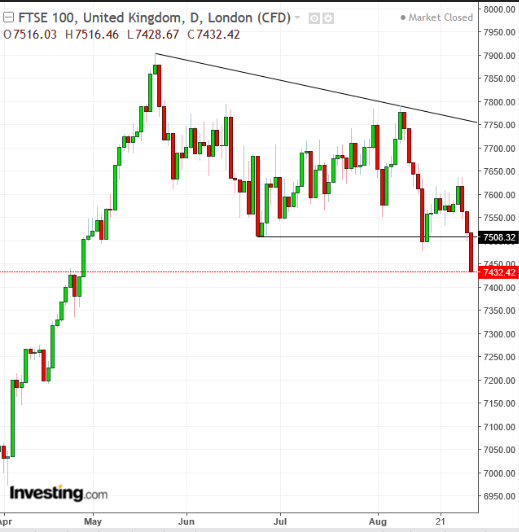
The UK' s FTSE 100 Index completed a descending channel, as supply overwhelmed demand and sellers continue to lower prices in search of willing buyers.
10:00: US – ISM Manufacturing PMI (August): expected to fall to 57.6 from 58.1.
21:30: Australia – GDP (Q2): growth to be 0.8% QoQ from 1%, and 2.8% YoY from 3.1%.
21:45: China – Caixin Services PMI (August): expected to fall to 52.7 from 52.8.
Wednesday
4:30: UK – Services PMI (August): forecast to rise to 53.9 from 53.5.
8:30: US – Trade Balance (July): deficit to widen to $47.6 billion from $46.3 billion.
8:30: Canada – Trade Balance (July): deficit to expand to C$0.8 billion from C$0.63 billion.
10:00: Canada – BoC Rate Decision: Expected to remain at 1.5 percent.
Thursday
8:15: US – ADP Report (August): 188K jobs expected to have been created, down from 219K a month earlier.
10:00: US – ISM Non-Manufacturing PMI (August): forecast to rise to 57.0 from 55.7.
11:00: US – EIA Crude Inventories: forecast to rise to -0.88M from -2.566M.

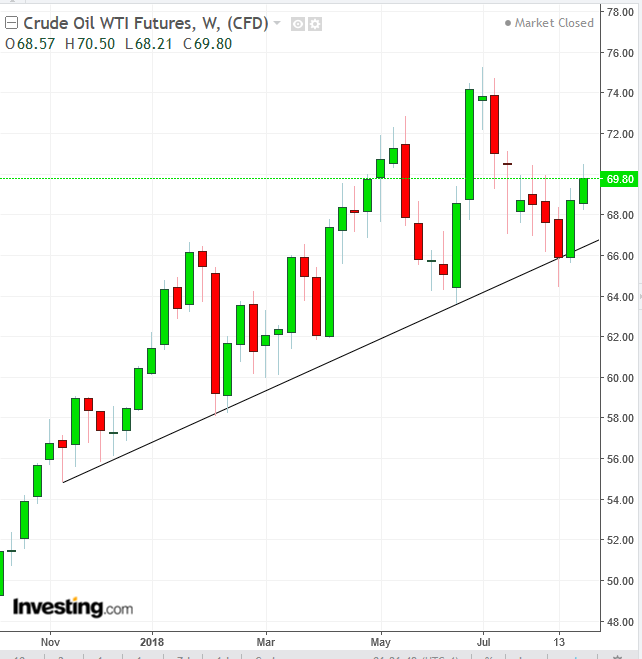
While oil prices have been boosted by looming US sanctions on Iran and falling Venezuelan output, the strong dollar has been pressuring black gold. Technically, the price extended a second week rally, after successfully retesting the uptrend line since November.
Friday
2:00: Germany – Trade Balance (July): surplus rose to €19.5 billion from €19.3 billion. Be prepared for a possible backlash from President Trump, as this data may fuel his ire regarding his long-standing complaint about Germany’s trade surplus.
5:00: Eurozone – GDP (Q2): expected to remain at 0.4% QoQ and to remain at 2.2% YoY.
8:30: US – Nonfarm Payrolls (August): NFPs expected to come in at 190K from 157K last month, while the Unemployment Rate is expected to edge down to 3.8% from 3.9 percent. Average hourly earnings will probably remain flat at 0.3 percent MoM and 2.7 percent YoY.
8:30: Canada – Employment Change (August): 5.1K jobs forecast to have been created, from 54,100 a month earlier; the Unemployment Rate is seen to have edged up to 5.9 percent from 5.8 percent.
