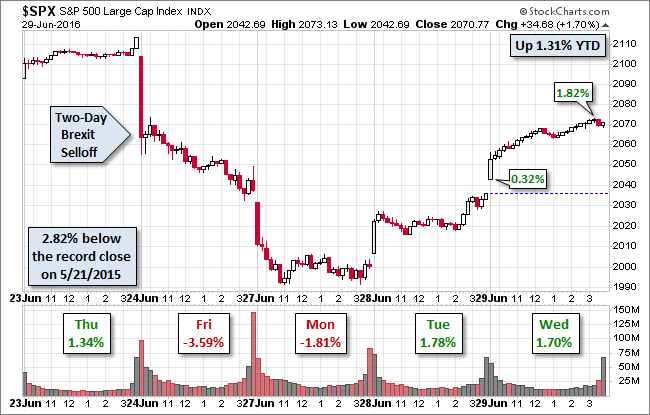
On a global basis, equity markets have essentially discounted last week's Brexit vote. Yesterday's rally, to one decimal place, put the Nikkei up 1.6%, the DAX 1.8%, the CAC 2.6% and the FTSE 3.6%. Our benchmark S&P 500 rose 1.7% Yesterday, just a tad off its 1.82% intraday high shortly before the close. The index is now back in the green year-to-date, up 1.31%.
Here is a snapshot of the past five sessions in the S&P 500.
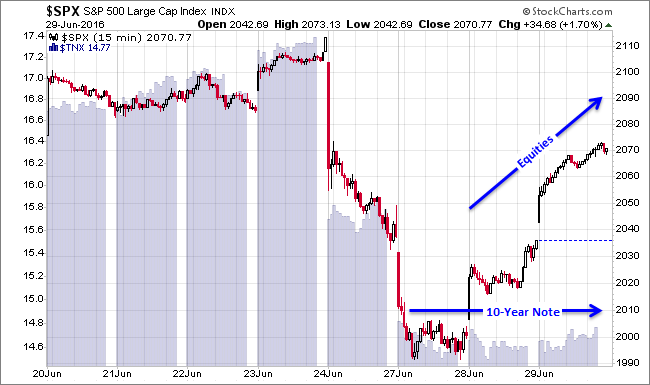
Treasuries, however, have not shown the same reversal. Here is a a 15-minute overlay of the 500 and the CBOE10-year Treasury yield index over the last eight sessions. Note that the two were moving in tandem prior to the Brexit vote and during the two-day selloff following the vote. But during the last two sessions, equities have rallied while the 10-Year yield has mostly trended sideways.
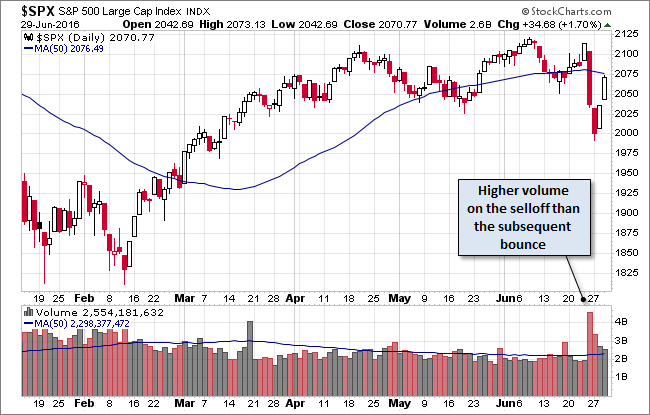
Here is a daily chart of the S&P 500. Note that the trading volume has been substantially higher on the Brexit selloff than on the bounce.
A Perspective on Drawdowns
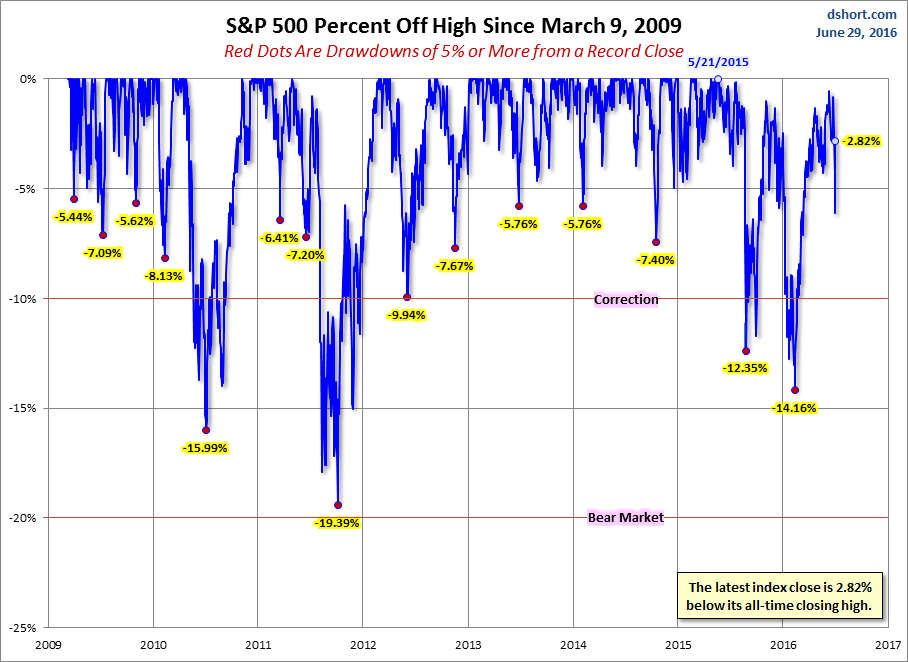
Here's a snapshot of selloffs since the 2009 trough.
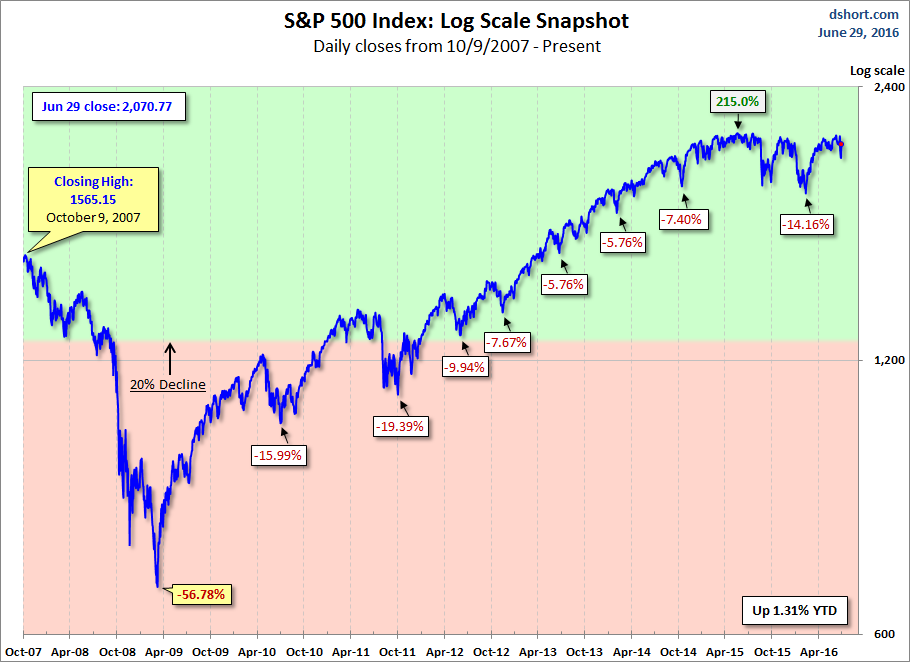
Here is a more conventional log-scale chart with drawdowns highlighted.
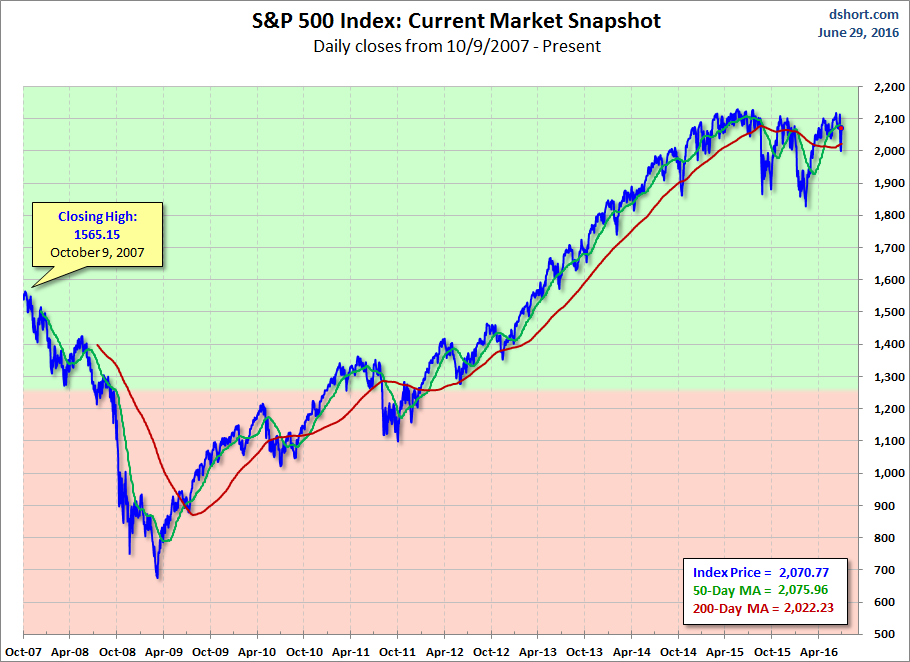
Here is a linear scale version of the same chart with the 50- and 200-day moving averages.
A Perspective on Volatility
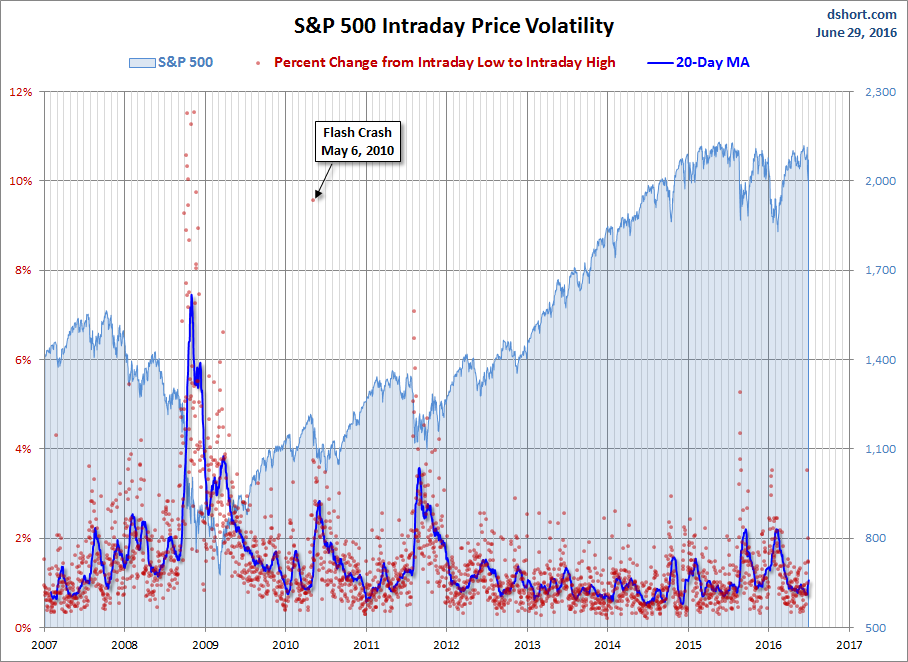
For a sense of the correlation between the closing price and intraday volatility, the chart below overlays the S&P 500 since 2007 with the intraday price range. We've also included a 20-day moving average to help identify trends in volatility.

