Netflix (NASDAQ:NFLX) is up 37% YTD, significantly more than the NASDAQ’s less than 20% gain. And though the video streaming giant performed only slightly better than the rest of its FAANG cohort — Facebook Inc (NASDAQ:FB) +34%, Apple (NASDAQ:AAPL) +25%, Amazon (NASDAQ:AMZN) +26%, with the exception of Google (NASDAQ:GOOGL), up only 3% — Netflix’s recovery has become a benchmark for other companies.
But most of that dramatic recovery took place in January when the shares gained 27% after a strong Q4 earnings performance. After that, despite beating on both earnings and revenue in its April 16 Q1 report, the company’s weak guidance, compounded by the retirement of its CMO Kelly Bennett, left the stock without fuel. It's now 2.5% below its April 17 price.
Where to from here? Well, that’s cloudy.
There are those, such as RBC Capital analyst Mark Mahaney who expect the stock to double within three years thanks to rising penetration overseas, healthy customer satisfaction and plenty more content lined up to keep viewers glued to their screens. On the other side of the trade we have Gene Munster, managing partner and co-founder at Loup Ventures. He is not as optimistic, due to rising costs, increased competition, and believes the company has plateaued.
Sum Zero’s David Trainer sees the stock plummeting, citing its massive spending, and says subscriber growth should be disregarded unless the company is able to monetize its original content before competition eats into its market share. Half the world population signing on to the streaming service is required to justify its $350 per share valuation, which Trainer considers unrealistic.
We are inclined to agree with the latter outlook, based on the stock’s technicals.

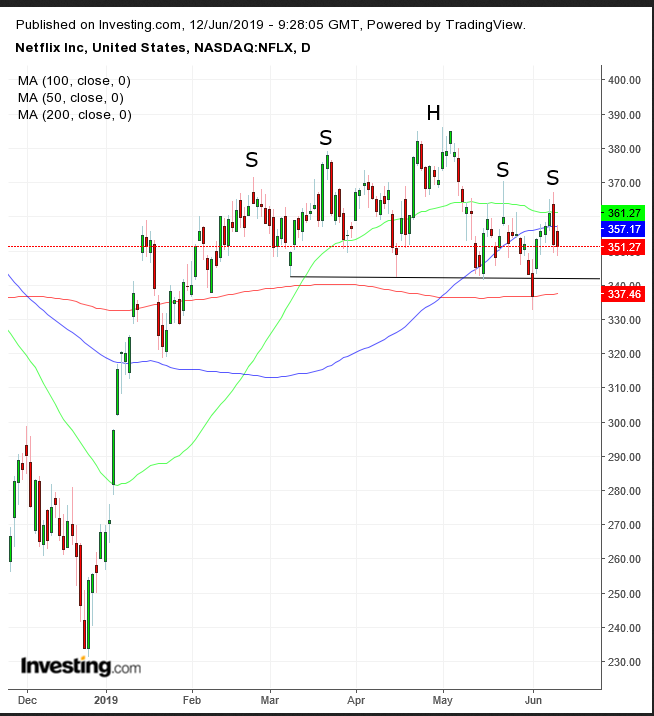
The trading pattern has been forming an H&S top. The 200 DMA retraces the pattern’s neckline, underlining its significance and increasing the pessimistic outlook if it fails to support the price.
The implied target is $300, a round psychological number that compounds the vested interest in the December highs.
However, should the company be hit with bad news, such as disappointing Q2 earnings which are due mid-July, this would push the stock below its December lows. It would then have posted the second trough required for a long-term downtrend (according to the more lenient interpretation of including the June-peak of the uptrend).
Trading Strategies
Conservative traders would wait for a close below the $330 level to minimize the risk of a bear trap, then wait for the expected return move to verify the resistance of the neckline or the 200 DMA, with at least a single long, red candle engulfing a green or small candle of either color.
Moderate traders may be content with a close beneath the $332 low, followed by a pullback for a better entry but not necessarily to verify the reversal.
Aggressive traders are likely to short upon a close below the 200 DMA. However, waiting for an upward correction would provide a much more manageable risk-reward ratio.
Trade Sample
- Entry: $340
- Stop-Loss: $345
- Risk: $5
- Target: $325
- Reward: $15
- Risk-Reward Ratio: 1:3
