by Pinchas Cohen
With all three major US indexes—the Dow, NASDAQ and S&P 500—posting fresh records on Friday and Japan's Nikkei 225 reaching a 21-year high earlier today, safe havens are being dumped. Why not, since stocks are making so much money?
Investor faith in the economy has been renewed as a Fed rate hike seems to be on the horizon and circumstances appear fortuitous for passage of President Donald Trump’s tax reform agenda. All this with a backdrop of the strongest global expansion since the Great Recession, European political uncertainties notwithstanding.
Gold the world's most popular safe haven, has suddenly become unpopular. At the current price of $1,277.13, it's fallen more than 6 percent from its September, $13,62.40 high. However, that doesn't mean the yellow metal is set to plunge.
Uptrend Remains Intact
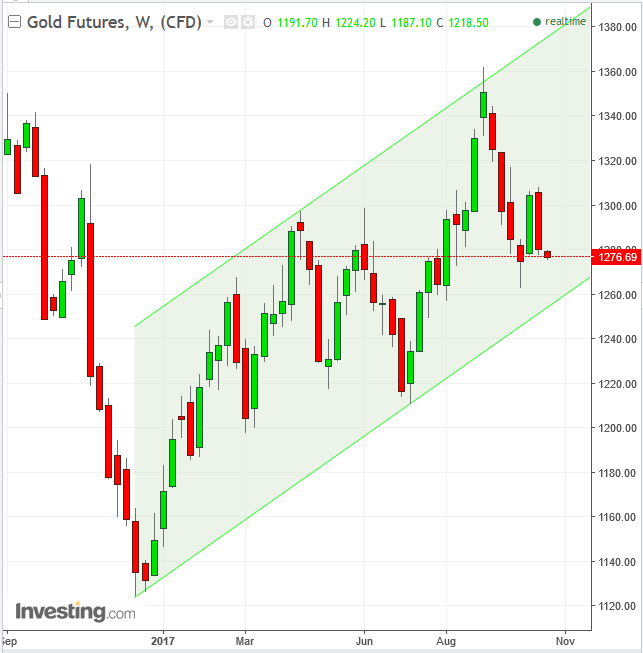
On the contrary, that decline happened after it registered a new high, solidifying a long-term uptrend that started with the death of the dollar's’s Trump Trade on December 15, 2016 when the US President himself weakened the currency by saying its strength was "killing us." As long as gold's price remains above $1,260, it is still clearly within an uptrend. If anything, its decline over the last 7 weeks could provide a golden buying opportunity.

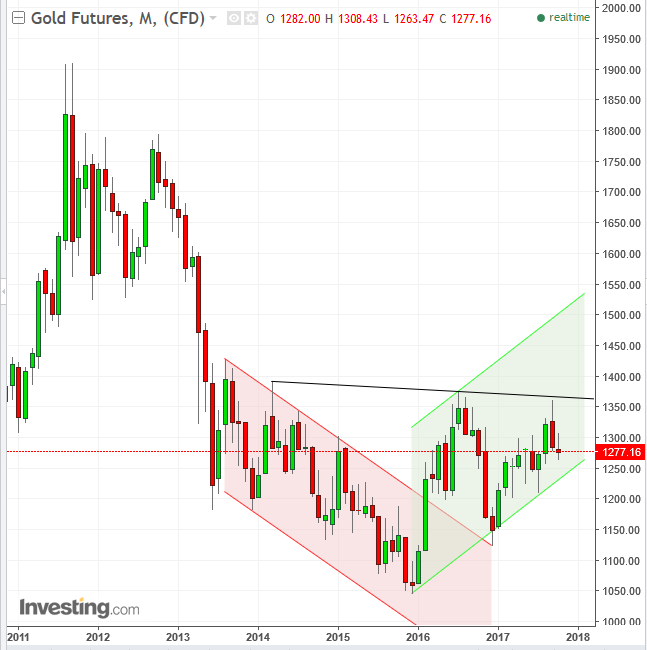
The red falling channel frames gold's downtrend. The falling price provided an upside breakout during February 2016. It retested the falling channel in December whereupon the channel-top’s support was confirmed.

Since then, the price of the precious metal has been trading within a rising channel, which has included two clear lows (December, July) and two clear highs (April, September). The current price of $1276.80 is a mere 1.5 percent above the channel bottom (or uptrend line), and 6.75 percent below the former, September peak, providing a 1:4.5 risk-reward ratio.
Trading Strategies
Conservative traders may wait on a long-entry for the price to retest the channel-bottom, which would include a touch of the uptrend line and a close higher than that day’s session.
Moderate traders may wait for a closer return move and enter a long position near the $1,262.80, October 2 low.
Aggressive traders may enter a long position now, placing a stop-loss under the $1,260 level.
Targets
- $1,308, October 16 high, a $30 target; a stop-loss below the October 6 $1,262.80 low would provide a 1:2 risk-reward ratio.
- $1,317, September 26 high, a $41 target; a stop-loss below the October 6 $1,262.80 low would provide a 1:2.73 risk-reward ratio.
- $1,362, September 8 high and the former peak within the uptrend; a stop-loss below the October 6 $1,262.80 low would provide a 1:5.7 risk-reward ratio.
- $1,500, psychological round-number; a stop-loss below the October 6 $1,262.80 low would provide a 1:15 risk-reward ratio.
- $1,650, a $300 move, the height of the potential-bottom upon a potential breakout at the $1,350 level.
Final Thought: What do you think it would mean for stocks if gold sees a 20 percent rise over the next year?
