The latest US CPI print saw risk markets again destabilise as the USD initially went higher alongside bond yields before a late turnaround. European shares continued to retrace lower while Euro itself was able to recover and head to a new daily high against King Dollar. The Australian dollar also rebounded but remains below the 67 cent level.
10 year Treasury yields spiked following the CPI print but eventually came back to almost where it started while oil prices lifted marginally with Brent crude finishing nearly 1% higher to just above the $78USD per barrel level. Gold continued its mild decline before also rebounding back to where it started to remain below the $2030USD per ounce level.
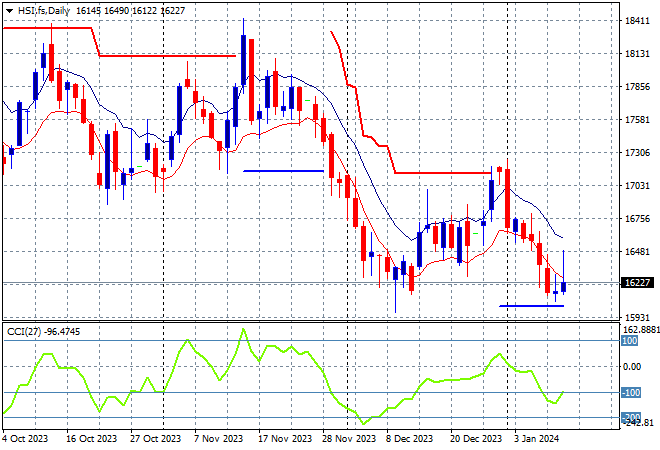
Looking at share markets in Asia from yesterday’s session where mainland Chinese share markets are up in afternoon trade as the Shanghai Composite again remains below the 2900 point barrier, closing some 0.4% higher at 2890 points while in Hong Kong the Hang Seng Index was up nearly 1.2% to 16302 points.
The daily chart was showing a significant downtrend that had gone below the May/June lows with the 19000 point support level a distant memory as medium term price action remained stuck in the 17000 point range before this new losing streak. Daily momentum readings are retracing back to oversold settings as price action wants to return to the October lows, with little chance of stabilising here:
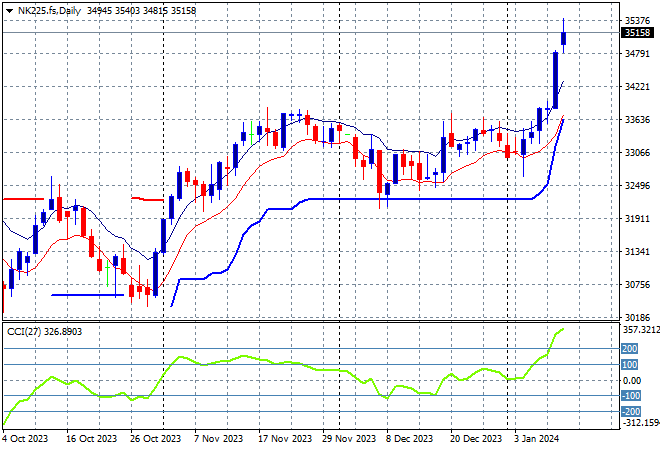
Japanese stock markets were still moving to the upside with the Nikkei 225 up nearly 2% to 35049 points.
Trailing ATR daily support was being threatened by price action after this bounce went beyond the September highs at the 33000 point level with daily momentum now returning to the overbought zone. Correlations with a stronger Yen are breaking down here with a selloff back to ATR support at 32000 points unlikely as the November highs are wiped out in this breakout:
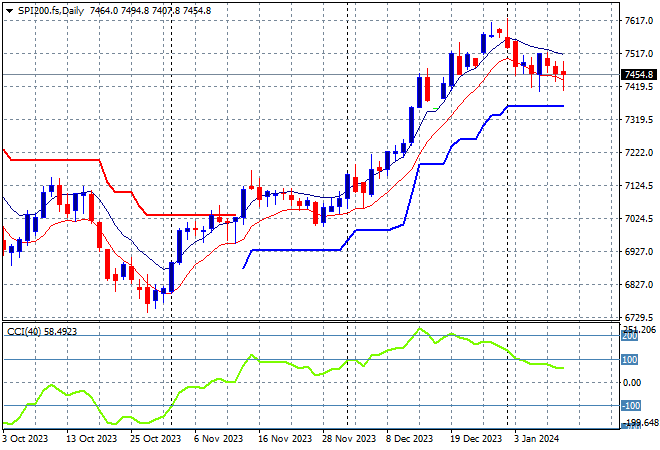
Australian stocks took back most of their recent losses, with the ASX200 up more than 0.5% at 7506 points.
SPI futures however are down nearly 0.5% after the scratch sessions on Wall Street overnight. The daily chart is no longer looking very optimistic here in the medium term with short term price action however suggesting a possible reversal underway as daily momentum starts to wane and resistance at the 7600 point level builds. Watch for any dip below the low moving average:
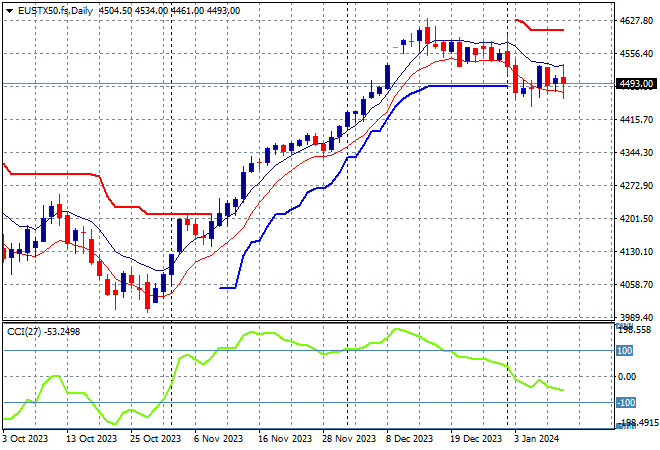
European markets are starting to falter with some broad losses across the continent as the Eurostoxx 50 Index finished more than 0.6% lower at 4442 points.
The daily chart shows weekly support remaining firm at the 4480 point level but a failure to make a new high above the early December 4600 point level is starting to drag overall momentum down with a full retracement now below overbought settings. Futures are indicating a neutral session ahead so watch daily support which should remain strong here:
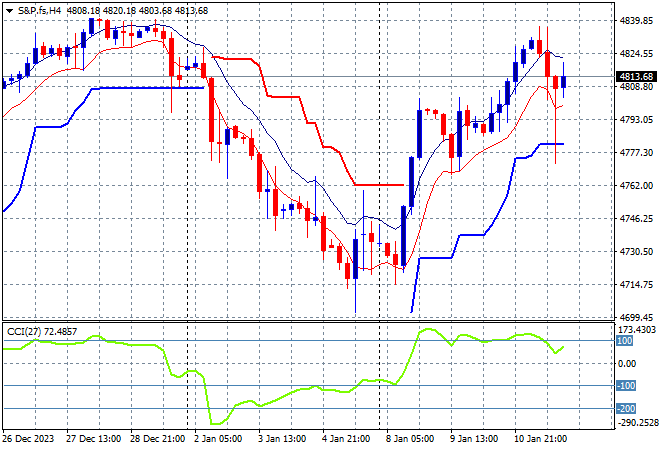
Wall Street did not like the slightly strong CPI print with scratch sessions across the board as the NASDAQ finished dead flat while the S&P500 closed a few points lower at 4780 points.
Short term momentum is now retracing out of oversold territory on the four hourly chart, with a very strong breakout pushing through trailing ATR resistance. Support has been strong at the 4700 point level proper but its obvious that the December highs are building as very strong resistance:
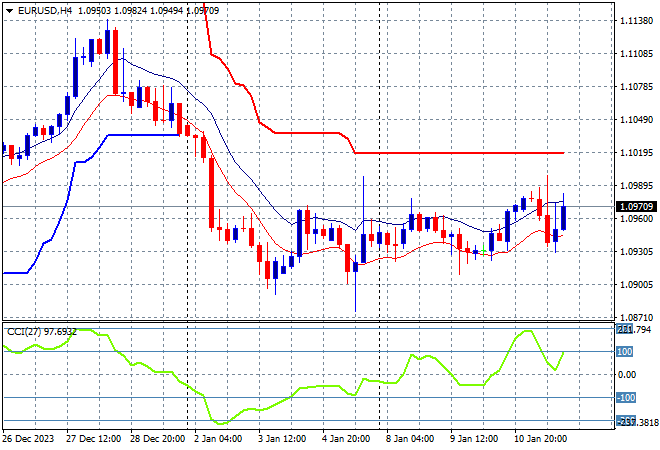
Currency markets absorbed the latest US CPI print without too much volatlity with a breakdown and a rebound against USD the order of the day. Euro fell back only slightly before getting back on track to match its current intrasession high at the 1.0970 level.
The union currency was looking weak but with the potential for a swing trade higher before the print but short term momentum has switched to positive even though price action is still well below trailing ATR resistance after bouncing off the December lows:
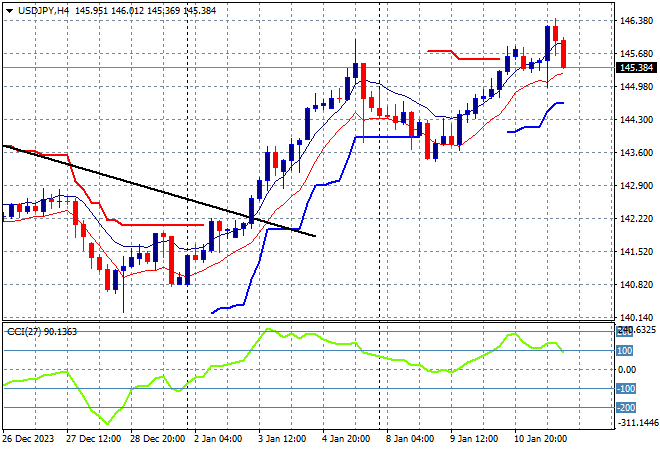
The USDJPY pair initially broke out but also ran into trouble post the print with a mild retracement back to the 145.30 level that matches the previous weekly high.
Four hourly momentum is still somewhat overbought as the medium term trend (sloping black line) remains broken here with price action almost exceeding last week’s high, but I think this move was a little too fast so watch for a possible retracement:
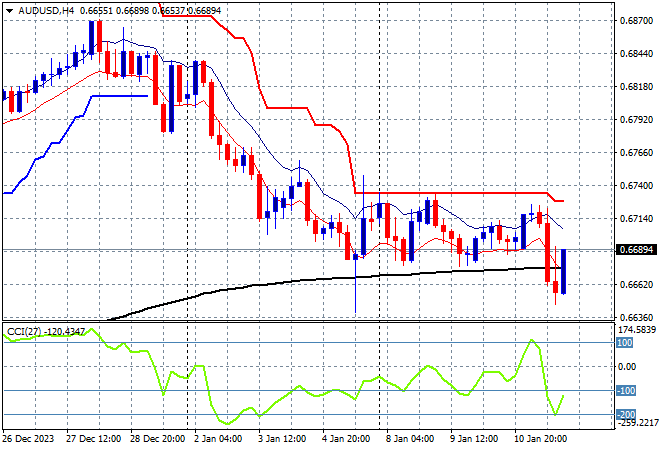
The Australian dollar iniitally brokedown before the CPI print and then gained almost half of that back but is still very weak here as it remains below the 67 cent level.
The Aussie has been under medium and long term pressure for sometime with the latest rally just a relief valve being let off with short term momentum returning to oversold territory as traders still have another month for the RBA to come back from holidays. Turn this chart upside down and you’d be bullish:
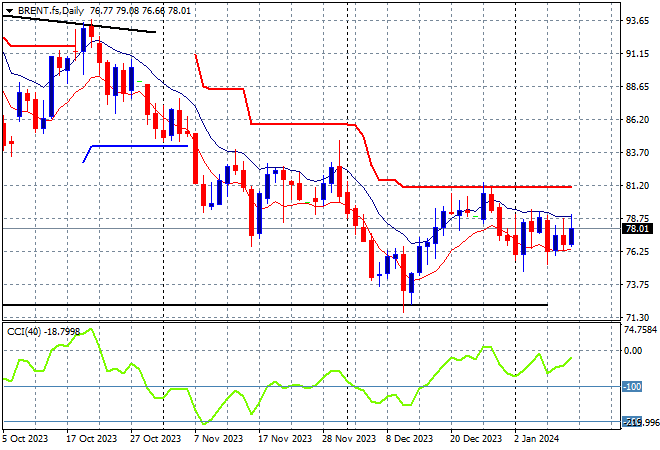
Oil markets saw a small lift overnight without much volatility, as Brent crude remains contained well below the key $80USD per barrel level with the downtrend also entrenched.
After almost reaching $100 in mid September, price was looking to return to the August levels around the $85 area where a point of control had been established before the recent breakout failed to push above trailing resistance at the $80 level. Daily momentum failed to get out of negative settings but is having another go here despite a possible retest of the December lows nearer the $70USD per barrel level soon:
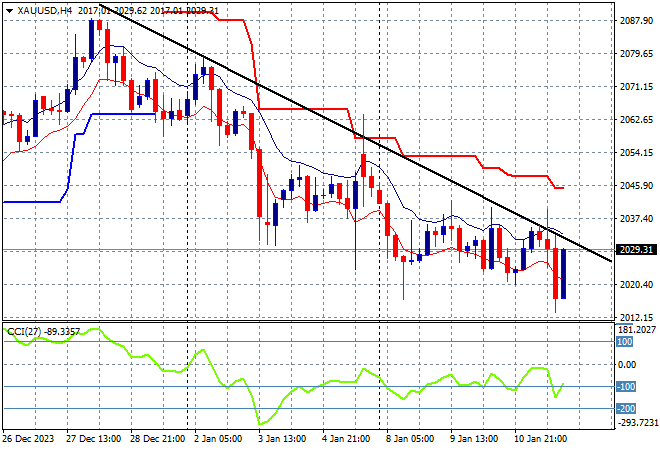
Gold is not finding much support in comparison with other undollars as it continues to flirt with a return to the $2000USD per ounce level as current price action remains anchored near the early December levels, closing slightly higher but below the $2030 level again.
Profit taking will continue here so watch the low moving average on the daily chart for signs of another possible dip with daily momentum still in the oversold zone: