- SPX up 28.67% so far for the year, on course to overtake the +29.68% hit at close of 2013.
- Expected January signing for Phrase I of trade deal and a dovish Fed may trigger traders to drive the S&P 500 high enough to make 2019 the best year of this bull market.
Major U.S. stock indices, including the S&P 500, Dow Jones and NASDAQ, finished the week at all-time-highs, signaling the potential for yet greater heights to be scaled in the holiday-shortened week to come. Equity benchmarks also saw their largest weekly advances since September. All of this was driven by the same catalyst—apparent progress on trade.
Markets Continue To Shrug Off Potential Risks
The S&P 500 Index jumped 1.65% for the week, its biggest weekly gain since the beginning of September, when it climbed 1.79% on one of the up cycles generated by the U.S.-Sino trade rollercoaster. At that time it moved back above the uptrend line since the December 2018 bottom.
Though markets may have priced in the de-escalation of trade hostilities, and U.S. President Donald Trump tweeted that he had a “very good talk with President Xi of China,” not even the Phase 1 portion of the agreement has been locked down yet. U.S. Trade Representative Robert Lighthizer said he expected the actual agreement to be signed in early January.
Still, despite the multiple on-again/off-again rounds of trade talks until now, market participants are considering this a done deal, perhaps because they simply can’t contemplate another reality. Then again, markets couldn’t entertain a world in which Britain would vote to leave the EU either, or that the U.S. would elect Donald J. Trump to the presidency. And yet, here we are.
However, markets seem to consistently shrug off those risks, notwithstanding the outcomes. Plus, after Fed policy as much as promised continued support for record highs, investors are now taking them up on it.
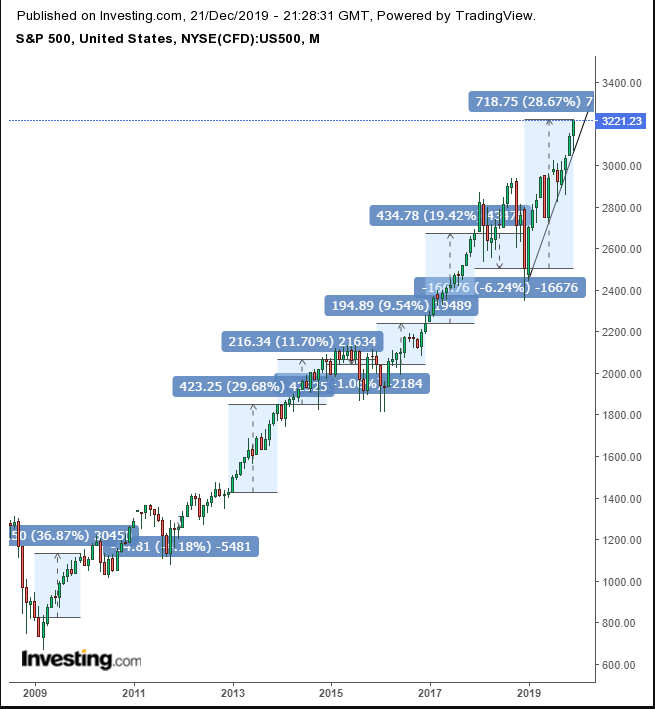
As of this past week, the S&P 500 is up 28.67% for 2019, in strong contrast to 2018's loss, when the benchmark finished the year at negative 6.25%. It's also the biggest annual gain since 2013, when the SPX added 29.68%.
If a so-called Santa rally boosts shares further, into the final trading days of 2019, the S&P 500 could best that year’s gains, in which case it would be the most profitable year—on a percentage basis—since the 2009 bottom, for the biggest annual advance of this bull market.
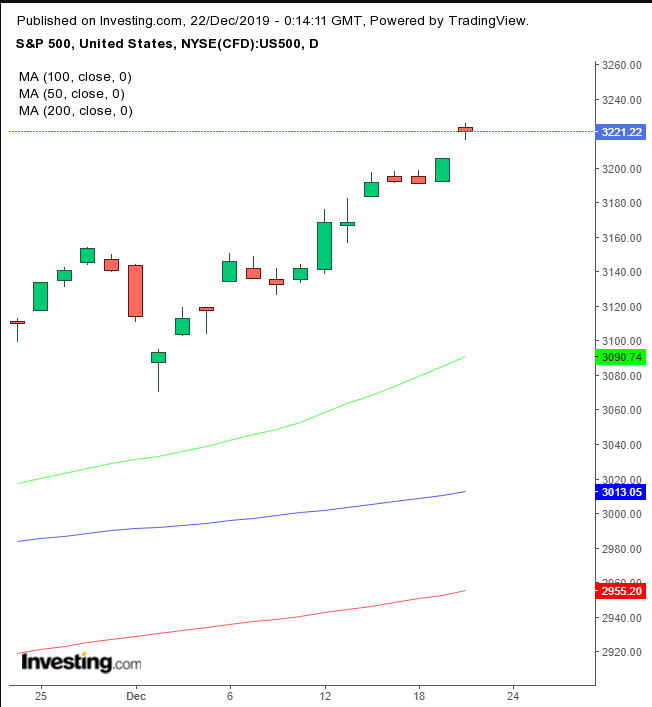
Of course, that then begs the question, would the possible biggest year since the bull market began increase the odds that the bull market will keep surging into 2020? Or would it become more likely to act as the book-end for the longest equity market expansion on record? Friday’s rising gap is a classic set-up for an Island Reversal.
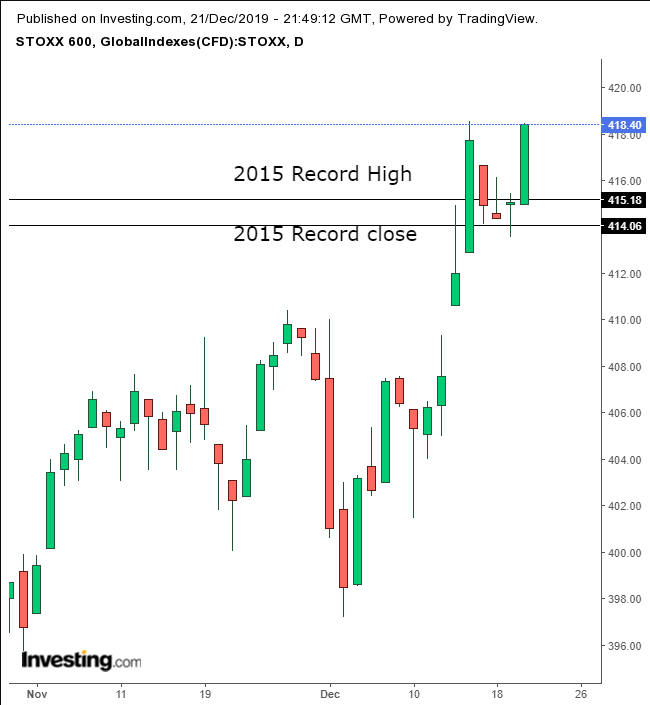
The STOXX Europe 600 Index also hit a record on Friday, both on a closing and intraday basis. It was the first week in which the index has done this since April 2015.
The yield curve between the U.S. 2-year and 10-year Treasury notes remained near its steepest level in more than a year, underscoring that recession worries have receded.
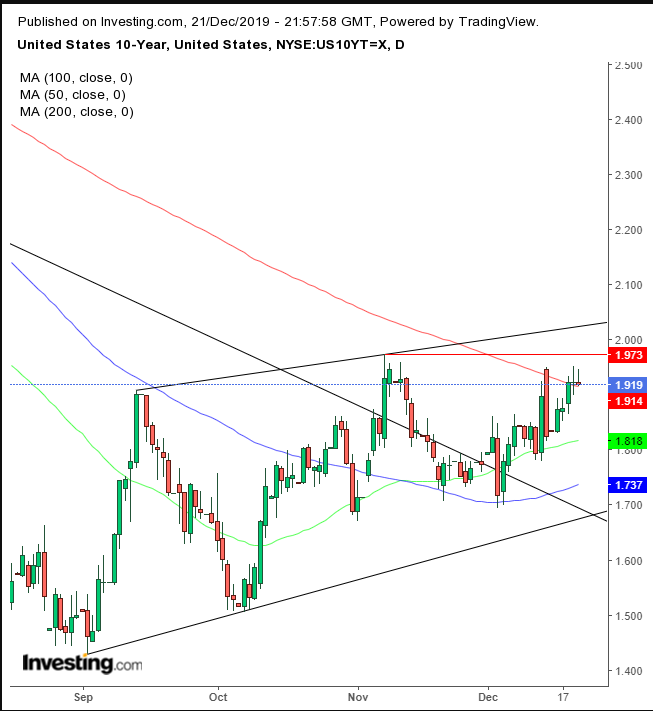
Technically, rates have been trending within a rising channel since the September bottom, crossing above the downtrend line in place since November 2019 on Dec. 4. However, we would feel more comfortable making this call by relying on a reversal, after yields penetrate the 2.00 psychological level. They have struggled with the 200 DMA since Dec. 15, coinciding with the Nov. 7 high, the first attempt to turn the long-term downtrend line into a floor.
And while the logjam in UK politics is over after Boris Johnson's resounding victory in the Dec. 12 election, the prospect of a messy break-up with the European Union is back on the agenda. The pound saw its worst weekly decline in more than two years amid concern that Prime Minister Boris Johnson and EU negotiators will struggle to agree on a trade deal next year.
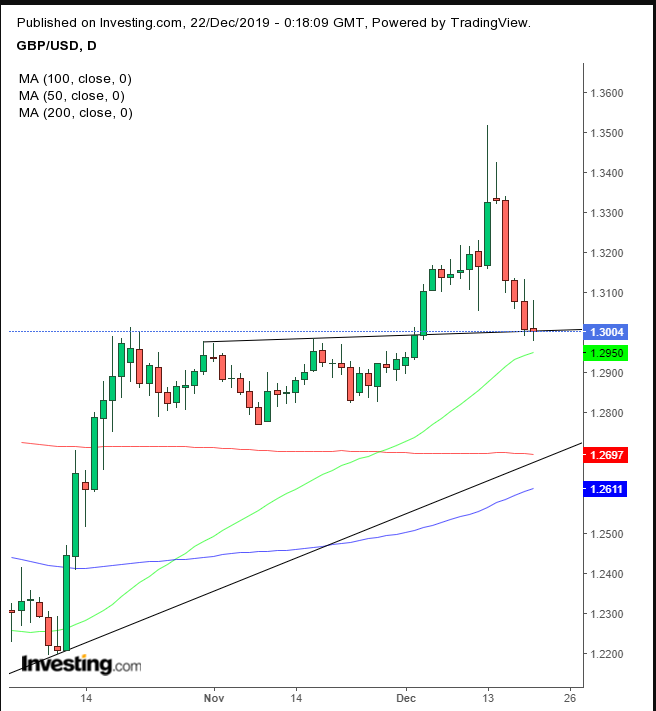
From a technical perspective, however, the recent plunge is nothing more than profit-taking ahead of another jump. So far, the price remained above the support of a bullish pattern.
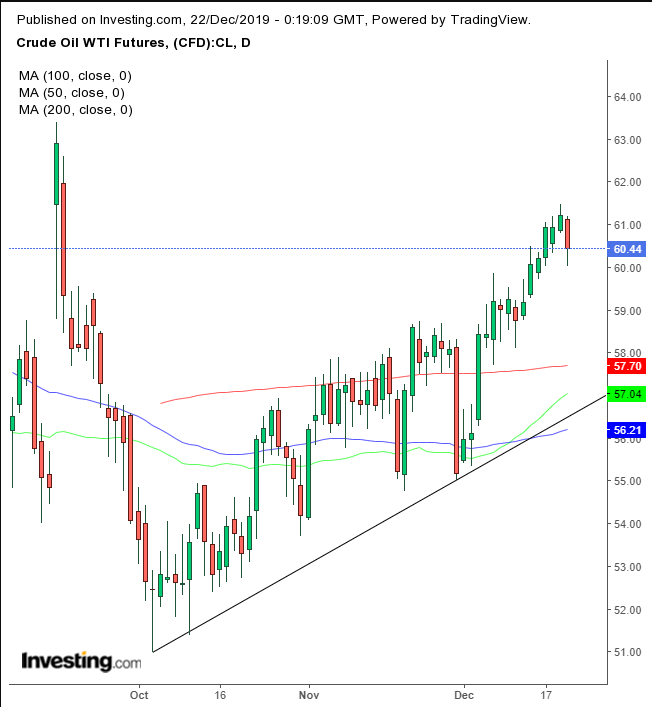
WTI crude slumped on Friday, dropping 1.2%, to close at $60.44. The commodity slipped from its three-month high.
The Week Ahead
All times listed are EST
Monday
7:30: U.S. – Core Durable Goods Orders: expected to drop to 0.1% from 0.5%.
8:30: Canada – GDP: seen to remain flat at 0.1% MoM.
10:00: U.S. – New Home Sales: anticipated to have edged higher, to 735K from 733K.
Tuesday
Australia, Eurozone, Switzerland, UK – Christmas Eve Holiday, All Day
13:00: U.S. – Markets close early
Wednesday
Australia, Canada, Eurozone, Hong Kong, India, Singapore, Switzerland, UK, U.S. — Christmas Holiday
Thursday
8:30: U.S. – Initial Jobless Claims: seen to have slipped to 225K from 234K the week previous.
18:30: Japan – Tokyo Core CPI: anticipated to have remained flat in December, at 0.6% YoY.
18:50: Japan – Industrial Production: expected to have risen to -1.4% in November from -4.5% the month previous.
Friday
10:30: U.S. – Crude Oil Inventories: the previous reading showed a drawdown of -1.085M barrels.
