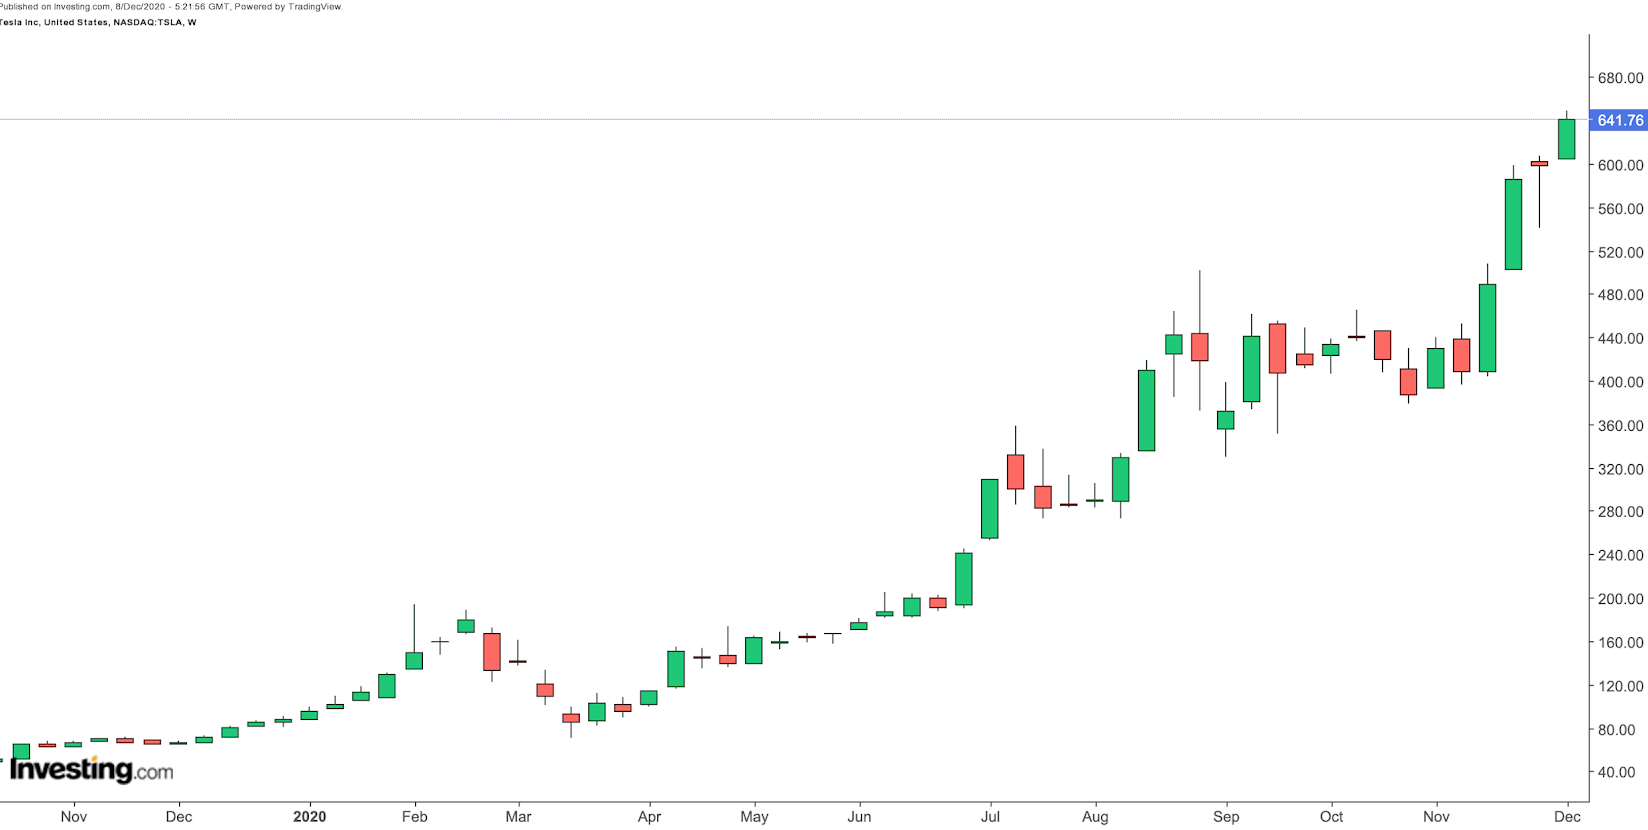
Tesla (NASDAQ:TSLA) is one of the most-watched names as Wall Street indices march steadily higher. Shares in the California-headquartered electric vehicle manufacturer hit a record high of $648.72 on Dec. 7.

Electric vehicle and alternative energy sectors have performed strongly in 2020. In early October, Tesla released Q3 metrics for vehicle production and deliveries. It delivered 15,00 Model S/X and 124,100 Model 3/Y vehicles.
During the third quarter, revenue was $8.77 billion. It also generated a profit of $331 million, making Q3 the company's fifth straight profitable quarter. Gross margin stood at 27.7%,
Year-to-date, the stock is up over 600%, so $1,000 invested in January 2020 would now be worth over $7,000. However, on a short-term basis, TSLA stock is highly volatile. Its beta, a concept}} we discussed recently, is over 2.
As a result, many retail investors may be hesitant about adding the carmaker's shares to their portfolios.
One way to participate in Tesla's growth story, without having to endure the stomach-churning intraday moves, could be to buy an exchange-traded fund (ETF) that includes TSLA stock as a holding.
On Dec. 21, the EV group will be added to the S&P 500 index. Then any fund, such as the SPDR S&P 500 ETF (NYSE:{{525|SPY), that tracks the index will include access to Tesla shares. There are currently well over 150 ETFs that include shares of the company among their holdings. Here are two such funds:
1. iShares U.S. Consumer Goods ETF
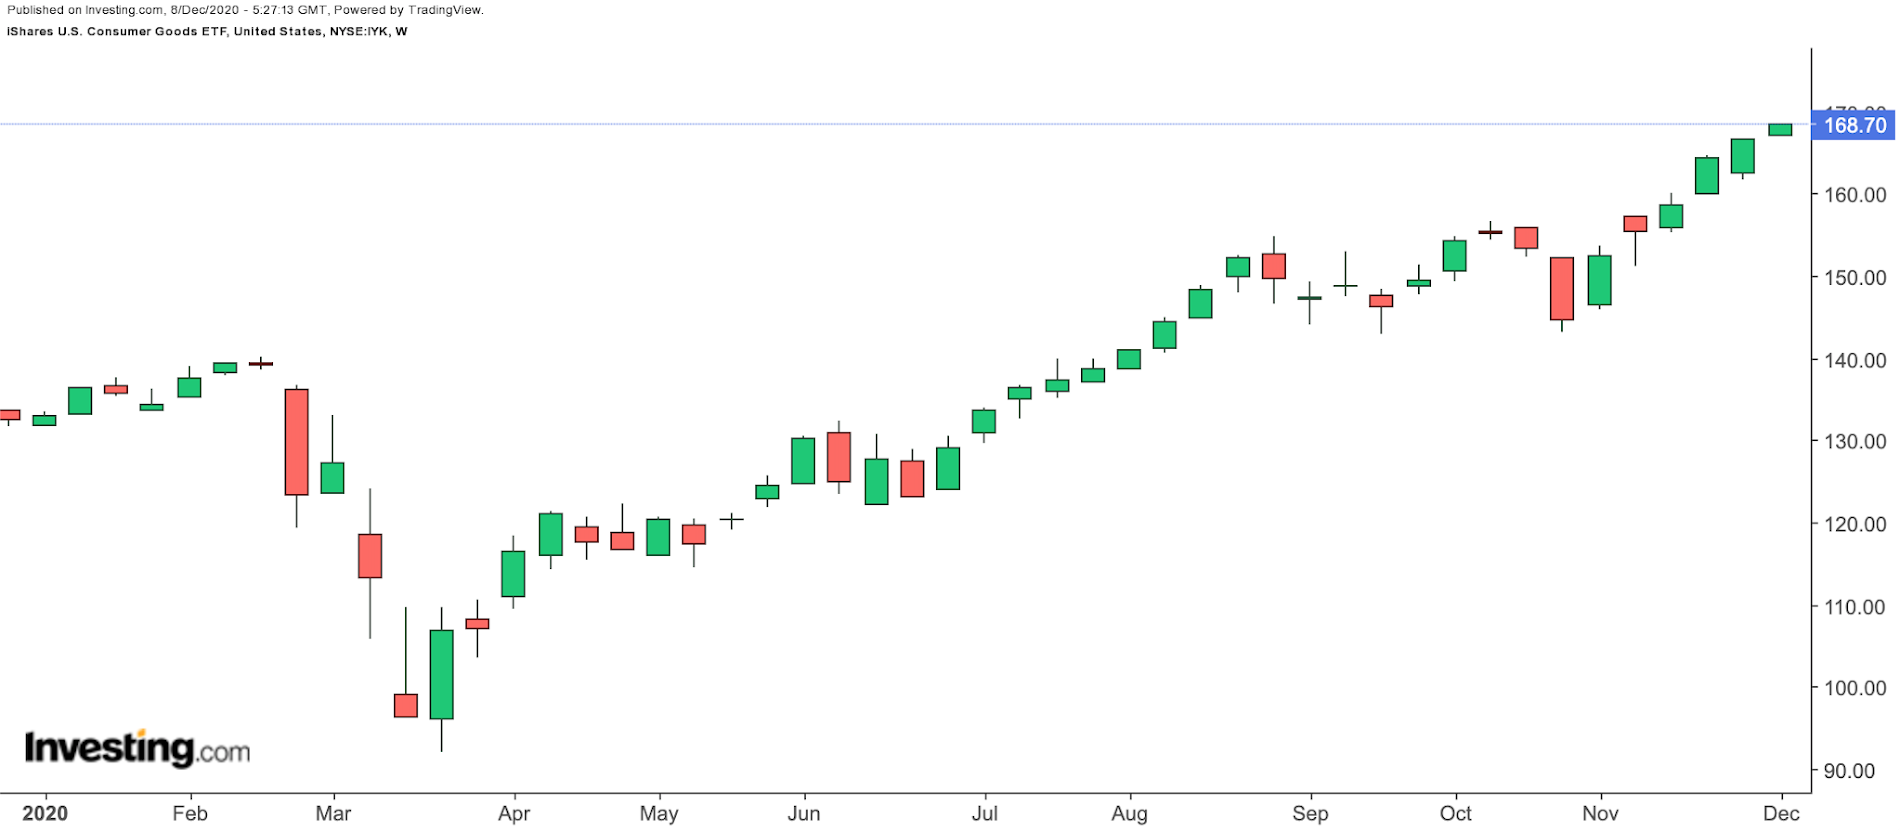
- Current Price: $168.70
- 52-Week Range: $92.00-167.48
- Dividend Yield: 2.01%
- Expense Ratio: 0.43%
The iShares U.S. Consumer Goods ETF (NYSE:IYK) provides exposure to U.S. consumer goods firms, such as food, automobiles, and household items. The fund started trading in June 2000, and assets under management are $711 million.

IYK, which has 96 holdings, tracks the Dow Jones U.S. Consumer Goods Index. The top ten stocks make up approximately 54% of total holdings.
As far as industries are concerned, funds are distributed among Food, Beverage, Tobacco (36.93%), Auto & Components (20.36%), Household & Personal Products (19.87%) and Consumer Durables (15.69%), among others.
The leading names in the ETF include Tesla, which accounts for 15.03% of the fund's total holdings, Procter & Gamble (NYSE:PG), one of the global leaders in the consumer products world, and carbonated soft drink giant Coca-Cola (NYSE:KO).
IYK has increased over 25% since the start of the year and hit a 52-week high on Dec 7. Trailing P/E and P/B ratios stand at 25.11 and 5.46, respectively. As a result of the recent run-up in price, these valuation metrics are relatively expensive. Those investors who would like to have exposure to shares of Tesla and U.S. consumer giants could consider investing in the fund, especially in the case of a short-term decline toward $155.
2. SoFi Select 500 ETF
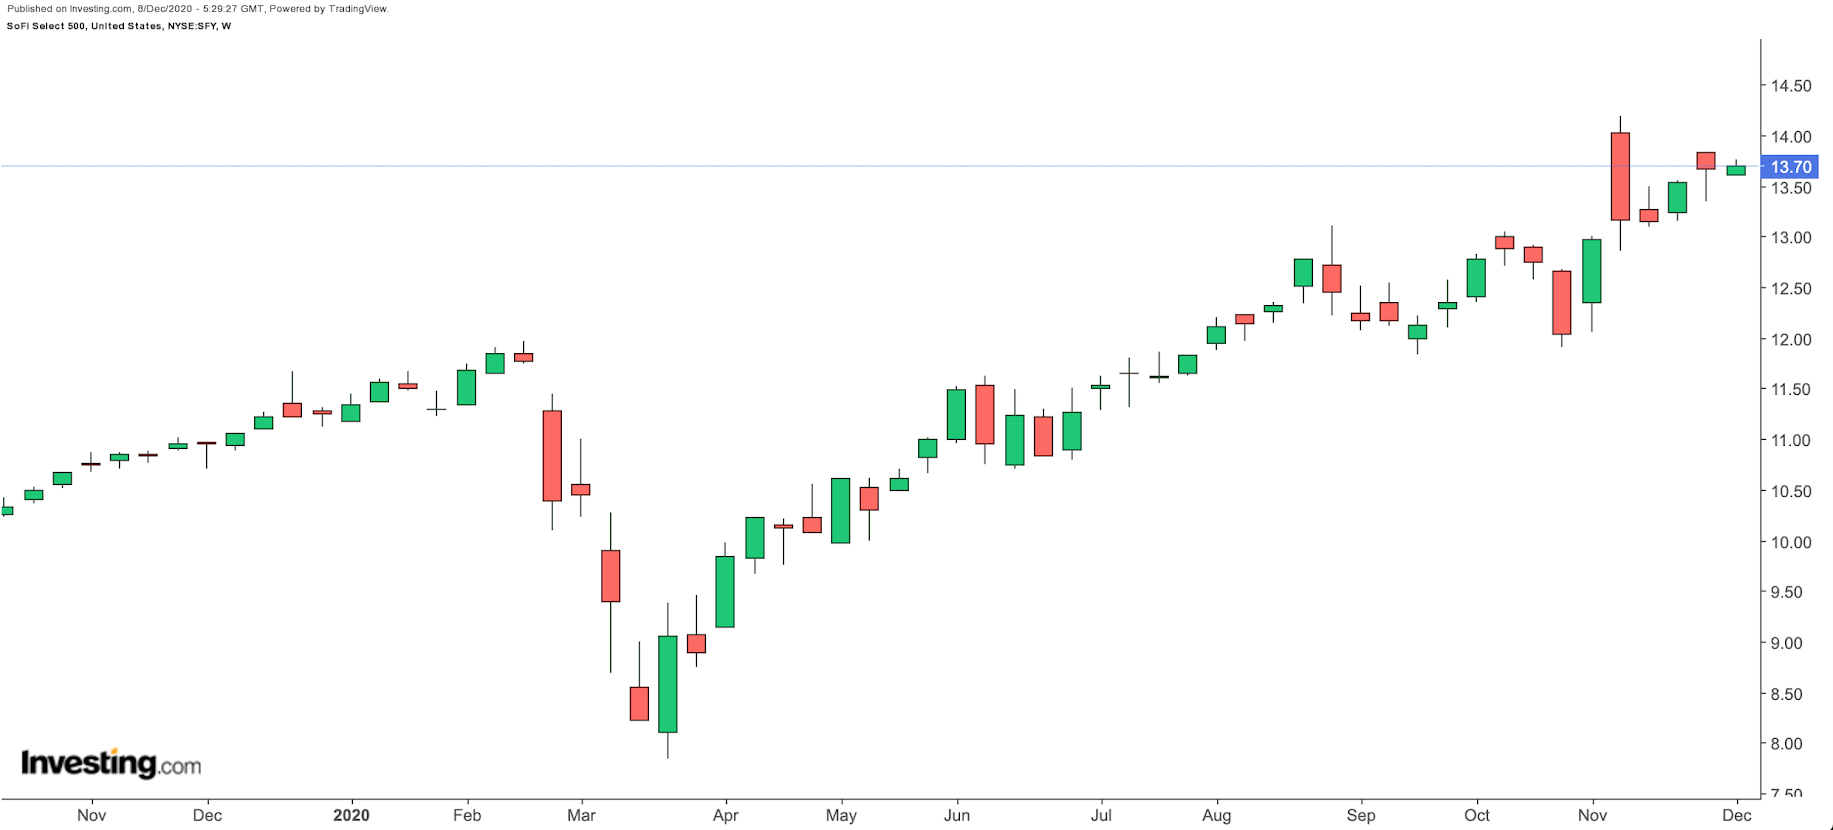
- Current Price: $13.70
- 52-Week Range: $7.84 - $14.20
- Dividend Yield: 1.17%
- Expense Ratio: N/A (fees currently waived)
The SoFi Select 500 ETF (NYSE:SFY) gives access to the 500 largest publicly-traded U.S. companies as measured by market capitalization. In determining companies' weightings in the ETF, the fund managers use metrics including sales growth and forward-looking revenue estimates.

SFY tracks the Solactive SoFi U.S. 500 Growth Index. The fund started trading in April 2019. As an enticement, annual expenses will be waived for investors during the first three years of the fund's trading.
The top ten stocks make up approximately 28% of net assets of over $110 million. Amazon (NASDAQ:AMZN), Apple (NASDAQ:AAPL), Microsoft (NASDAQ:MSFT), Berkshire Hathaway (NYSE:BRKa), (NYSE:BRKb) and Tesla, which has a 1.81% weighting, head the list of stocks in SFY.
As far as industries are concerned, funds are distributed among Technology (24.6%), Consumer Non-Cyclical (23.5%), and Communications (15.4%), among others.
SFY has returned over 22% since the start of the year and hit a record high in late November. Short-term profit-taking in some of the holdings may put pressure on the fund. Yet no single company's weighting is large enough to affect its value significantly. Those investors who believe in the growth story of most of the companies in the ETF could consider buying into the declines.
