Copper’s support at above $3 per lb has been unbroken for 25 sessions in a row. It has chalked up seven winning months out of eight, a phenomenal run for a metal many bullish investors in commodities had given up on just two years ago.
Year-to-date, copper is up 13%. That’s double its 2019 return of just under 6%. Prior to that, its performance was woeful, losing 19% in 2018.
According to commodities lore, one can predict world economic trends by studying the price of copper. The metal’s diagnostic ways are so fabled that it was even called ‘Dr. Copper.’
The red metal’s golden era was in the previous decade. It started January 2000 at 86 cents per lb on the New York Mercantile Exchange’s COMEX division and finished December 2009 at $3.33. A whopping 287% growth. Clearly, copper wasn’t just reflecting the economy in that decade—it was front-running it.
But that story unraveled over the next ten years.
Although global GDP growth was almost exactly the same this decade as the last—expanding by a compounded 30%, or an average of 3% per annum, between 2010 and this year—copper took a different path.
COMEX prices of the red metal went from their January 2010 start of $3.33 per lb to finish 2019 at $2.80—a 15% slump.
Hero To Zero … And Back!
In other words, in a span of just two decades, copper as the world’s leading industrial metal, had gone from hero to zero.
Why the total collapse in correlation?
One reason was that the latter half of the 2010-2019 decade was filled with fears of a global economic slowdown that put a cap on copper prices. For instance, the Trump administration’s trade war with top metals buyer, China was one the biggest antidotes to higher copper prices.
But this year, the infrastructure rebuilding required in China after the COVID-19 outbreak has boosted copper prices since April. This was despite the malaise in the global economy from the pandemic.
Back to the present: Where’s copper headed?
$3 Support May Be Tested, But Rebound Seen
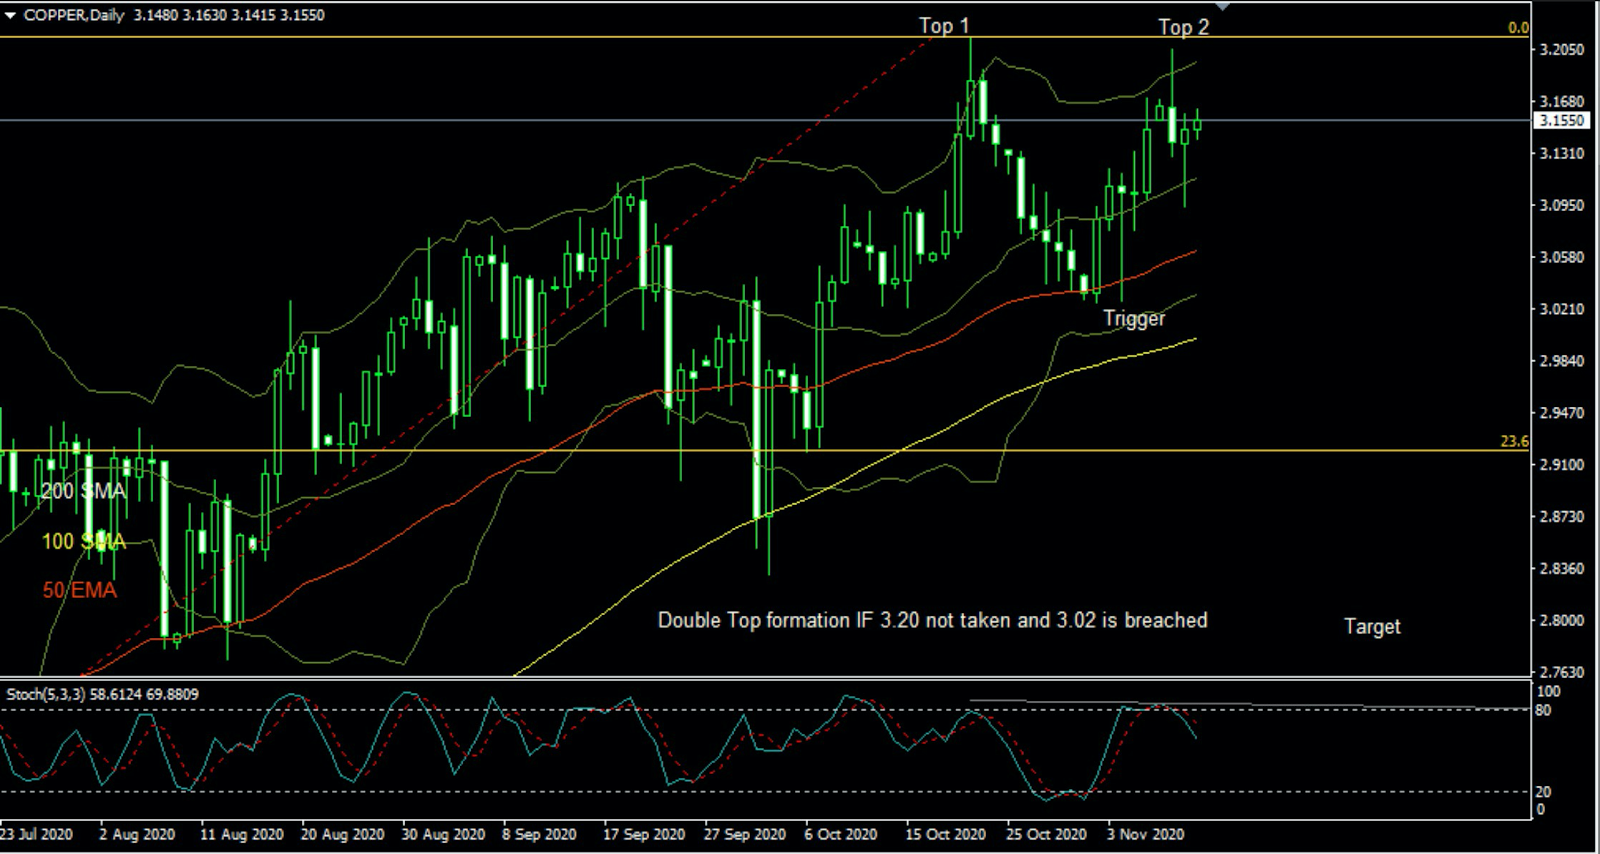
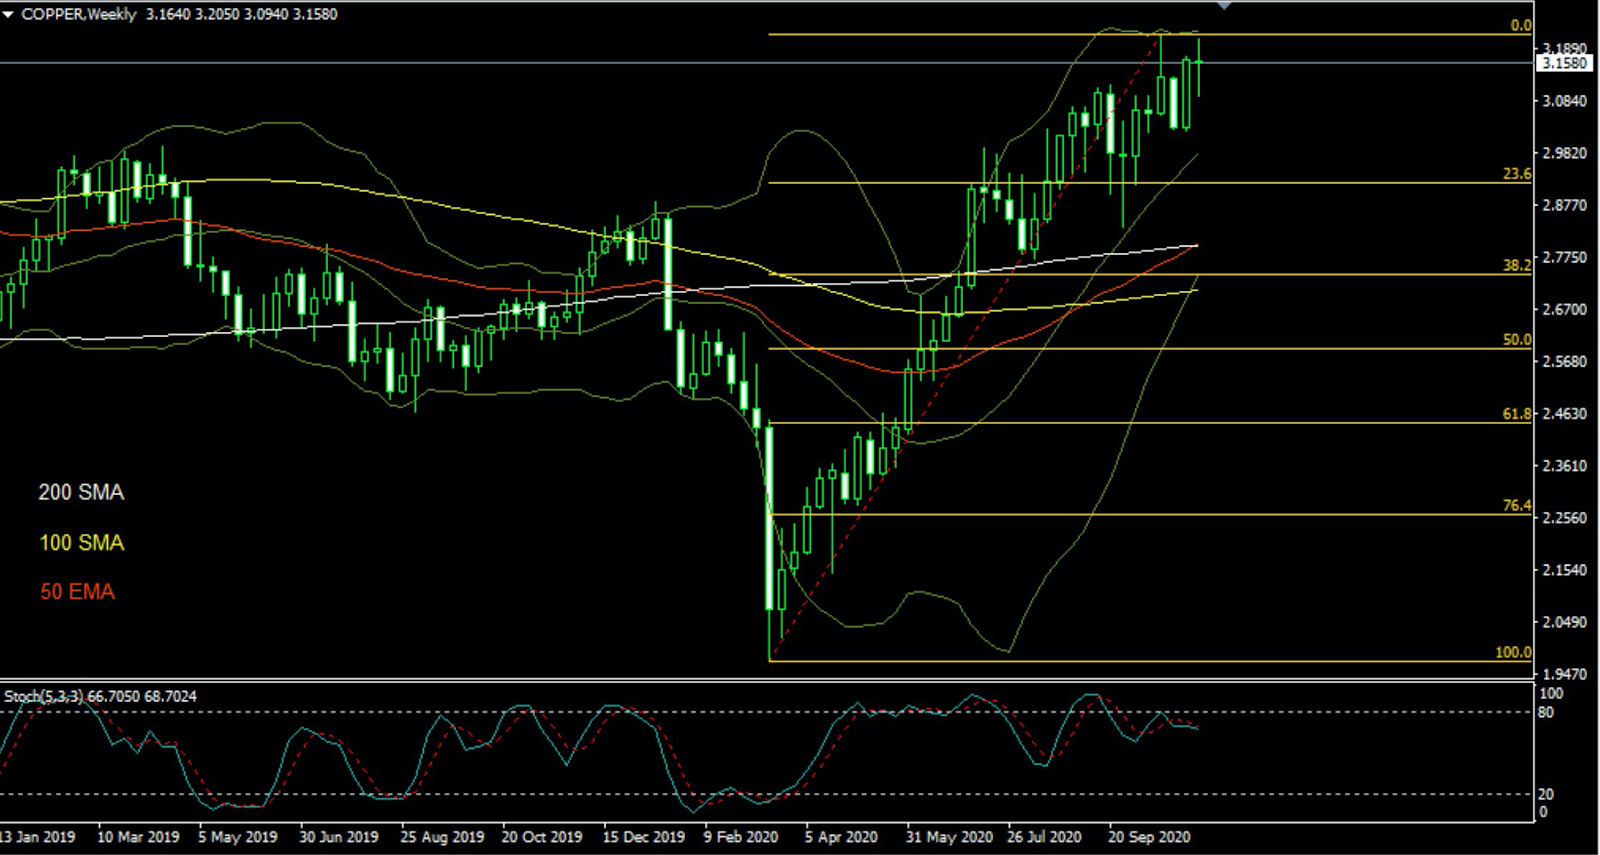
At least two chartists think a break of the $3 support for COMEX copper is in the offing. But they also argue that any downside will be brief as the metal remains fundamentally strong.

Charts courtesy of Sunil Kumar Dixit
U.K.-based Eno Eteng, who studies a broad range of commodities and securities, including forex and stocks, says copper’s ascending support trendline confirmed the continued restriction of its prices within the borders of what appeared to be a “rising wedge”.
In a blog on InvestingCube, Eteng wrote:
“This move also found support at $3.0920 and has propelled copper price above $3.1255, intending to hit $3.1865. However, failure of price to climb beyond this point converts the price pattern into a double top (peaks of 21 October and 9 November). This would place the $3.0275 price area as the neckline.”
“A break below the neckline then targets $2.9165 as the price projection of the double top’s resolution, which requires sellers to take out the wedge’s lower border, as well as $3.0010 and $2.9510.”
Eteng says for copper to remain strong, buyers would look for a break of the $3.1865 level to continue towards $3.2560 and $3.2710. He added:
“Clearance of the latter would probably invalidate the wedge in the long run.”
Coimbatore-based independent commodities chartist Sunil Kumar Dixit said the upside break in copper may be capped at $3.20 for now.
He adds:
“Any further rally will only be confirmed on taking on the previous $3.30 handle.”
“The corrective wave has a potential support at 2.80 which also coincides with the bullish confluence of the 50-day EMA (Exponential Moving Average) and the 200-day SMA (Simple Moving Average) on the weekly charts.”

On Investing.com’s end, while our base case for copper shows support unbroken at $3 for now, any disruptions in the economic narrative before the end of 2020 and beyond could change that.
Our Daily Technical Indicator has a “Strong Buy” on COMEX copper for December, with resistance pegged first at $3.1799, then $3.204 and finally at $3.2459.
Support begins at $3.119, then moves to $3.0749, before digging in at $3.0722.
As with all projections, I urge you to follow the charts but temper them with fundamentals—and moderation—whenever possible.
Good luck.
Disclaimer: Barani Krishnan uses a range of views outside his own to bring diversity to his analysis of any market. He does not own or hold a position in the commodities or securities he writes about.
