- Recent market shifts influenced by the Fed's decision and employment data have led to a decline in US Treasury yields and the US dollar.
- Despite the weakening economic data and geopolitical tensions, the economy has not yet shown signs of a recession, so the positive market sentiment may continue.
- The DXY index has fallen below a critical support level, potentially signaling a corrective phase and the possibility of further decline toward the 102 region.
Last week, the forex market was primarily influenced by the Fed decision and jobs report.
The {{eFed, while maintaining interest rates as expected, continued to underscore its determination to combat inflation, with a notable shift towards a more hawkish tone, which spurred an increase in risk appetite.
The employment data, released on the last business day of the week, further fueled the growing risk appetite, signaling that the impacts of the Fed's tightening monetary policy were beginning to manifest in the US economy.
As a result of these developments, US Treasury yields saw a significant decline, accompanied by a drop in US dollar. Yields on US 2-Year Treasuries continued their descent from the October peak of 5.25%, reaching 4.8% last week.
Similarly, 10-Year Treasury yields experienced a drop of over 5% last week, sliding from their 5% peak to 4.6% this week.
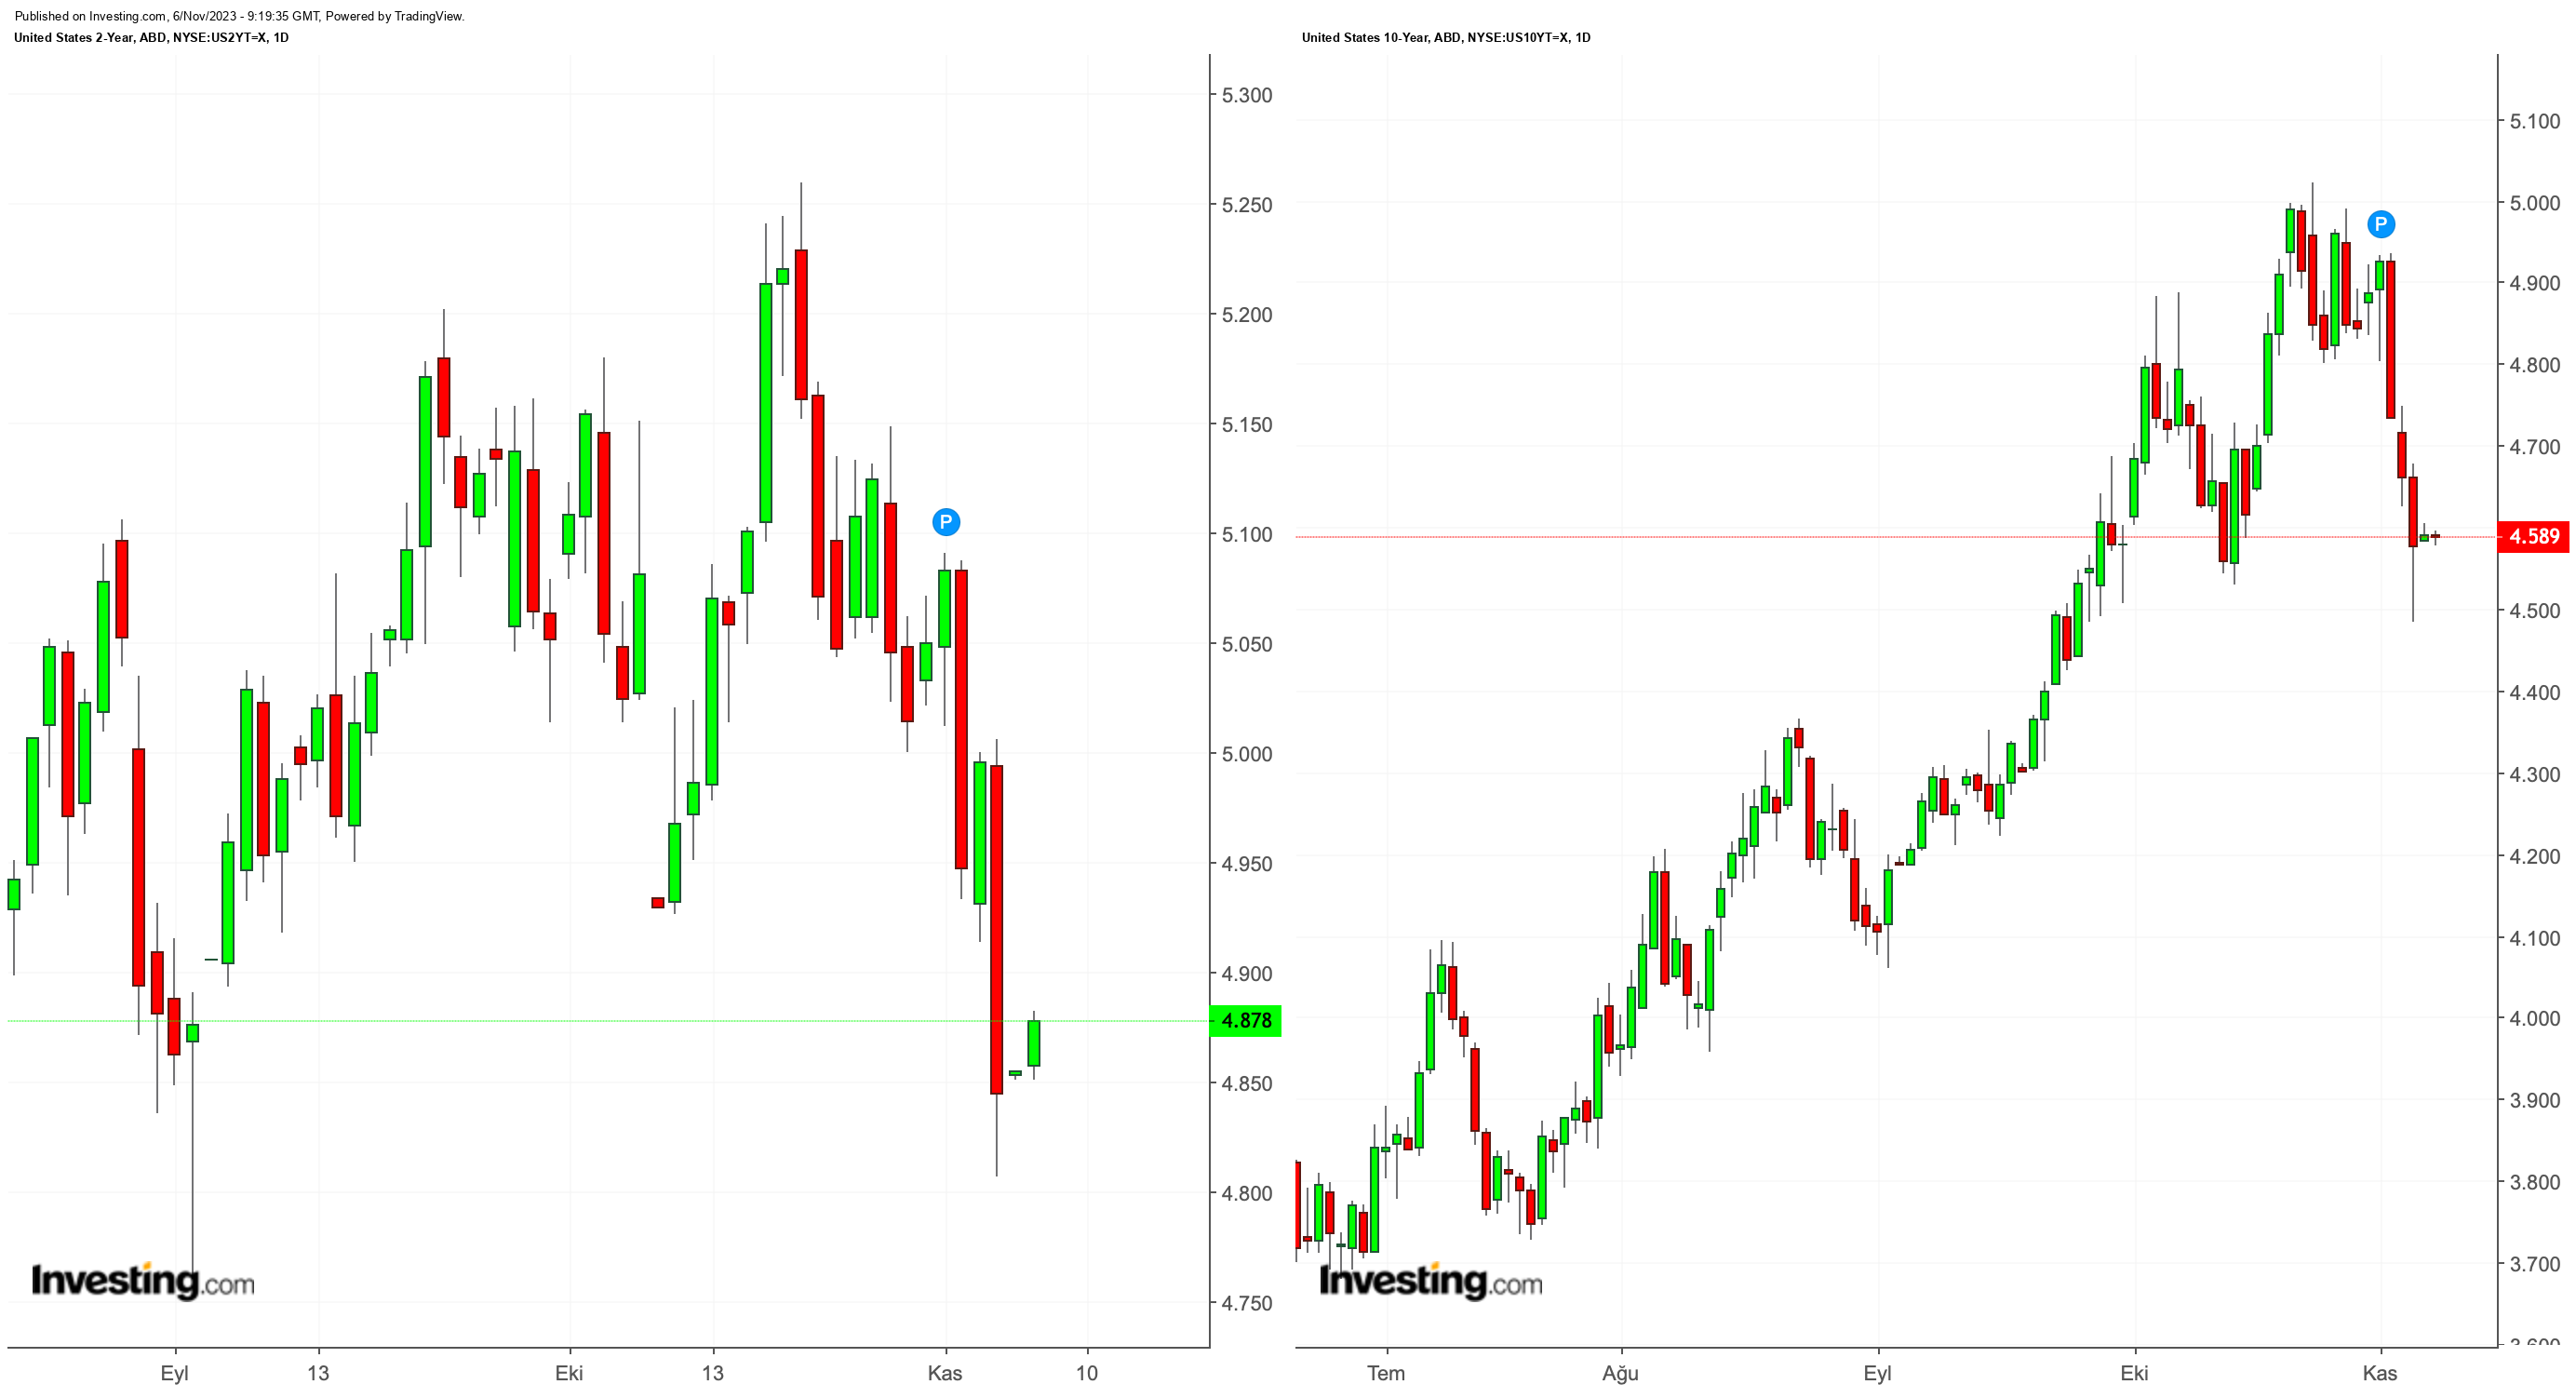
As the decline in bond yields continued to trigger a loss in the dollar, the DXY (US Dollar Index) retraced to the 104 level, shifting from a flat trend to a downward trajectory after last week. This momentum was fueled by the rapid ascent of major currencies against the dollar.
The increase in risk appetite also facilitated the best weeks for US indexes since November 2022. The Nasdaq surged by 6.48% and the S&P 500 by 5.85% last week, accompanied by a significant surge in demand, marking the end of the correction phase from the final week of October.
Despite the change in risk perception and weakening economic data, it appears that recession concerns have not yet surfaced in the stock markets. The continuation of the recovery, coupled with the seasonal effect, seems likely.
However, the sustainability of the positive market sentiment depends on several factors. Among these factors, one stands out as an external influence - geopolitical risk. The efforts to keep tensions low in the current environment contribute to limiting the impact of conflicts in the Middle East.
Moreover, preventing the expansion of conflicts regionally, as seen in the Russia-Ukraine war, may lead to a gradual reduction in geopolitical risk over time. On the other hand, in terms of the global economy, if advanced economies do not deviate from the path of inflation, it may prevent the adoption of stricter measures, leading investors to continue shifting away from the safe-haven perception and towards risky assets.
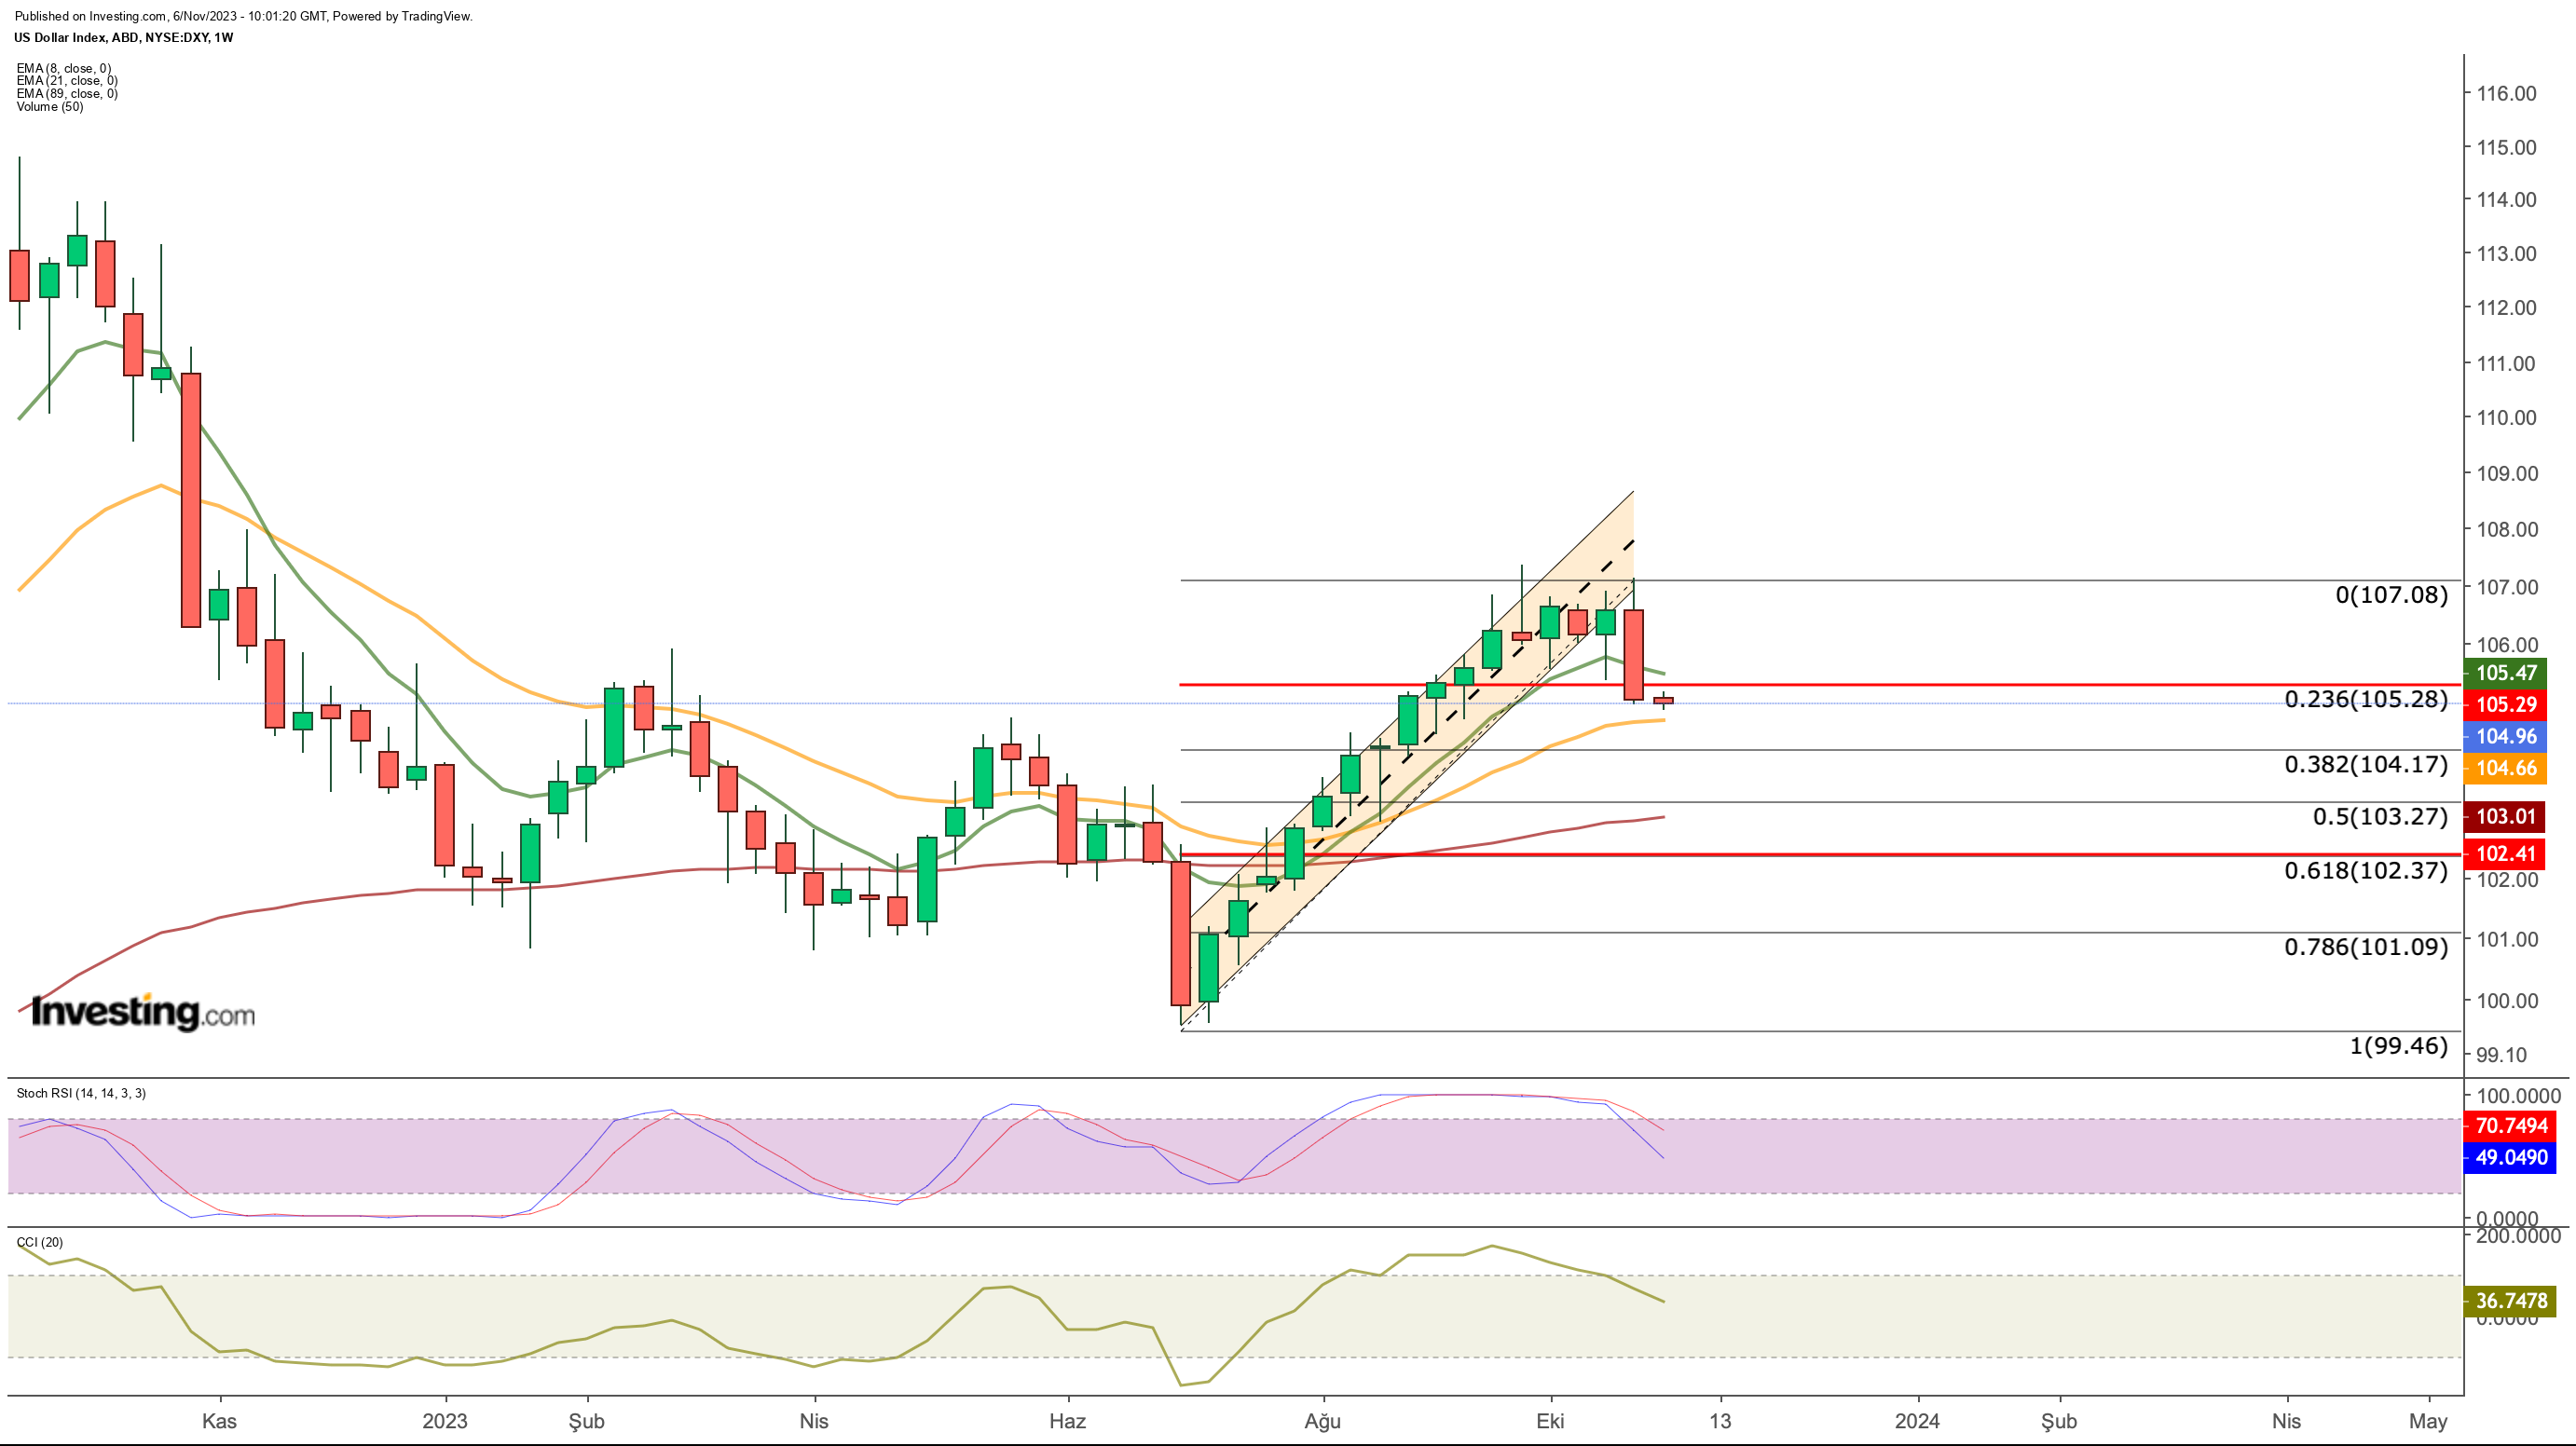
Recent developments have resulted in reduced demand for the dollar. Looking at the chart, the DXY index has fallen below a critical support level, indicating the beginning of a corrective phase.
As we mentioned in our analysis last week, the DXY made a sharp move downward below the 105.5 level on the last business day of the week. The weak outlook continues at the beginning of this week, with the next nearest support seen at the 104 level. If this support is breached, the DXY may continue to decline toward the 102 region. On the upside, last week's support level at 105.5 has now turned into resistance for this week.
EUR/USD Continues Moving Up in a Rising Channel
The momentum in EUR/USD is increasing as the euro continues to recover, driven by weakening demand for the dollar. The significant surge on last Friday allowed the EUR/USD pair to breach a crucial resistance level.
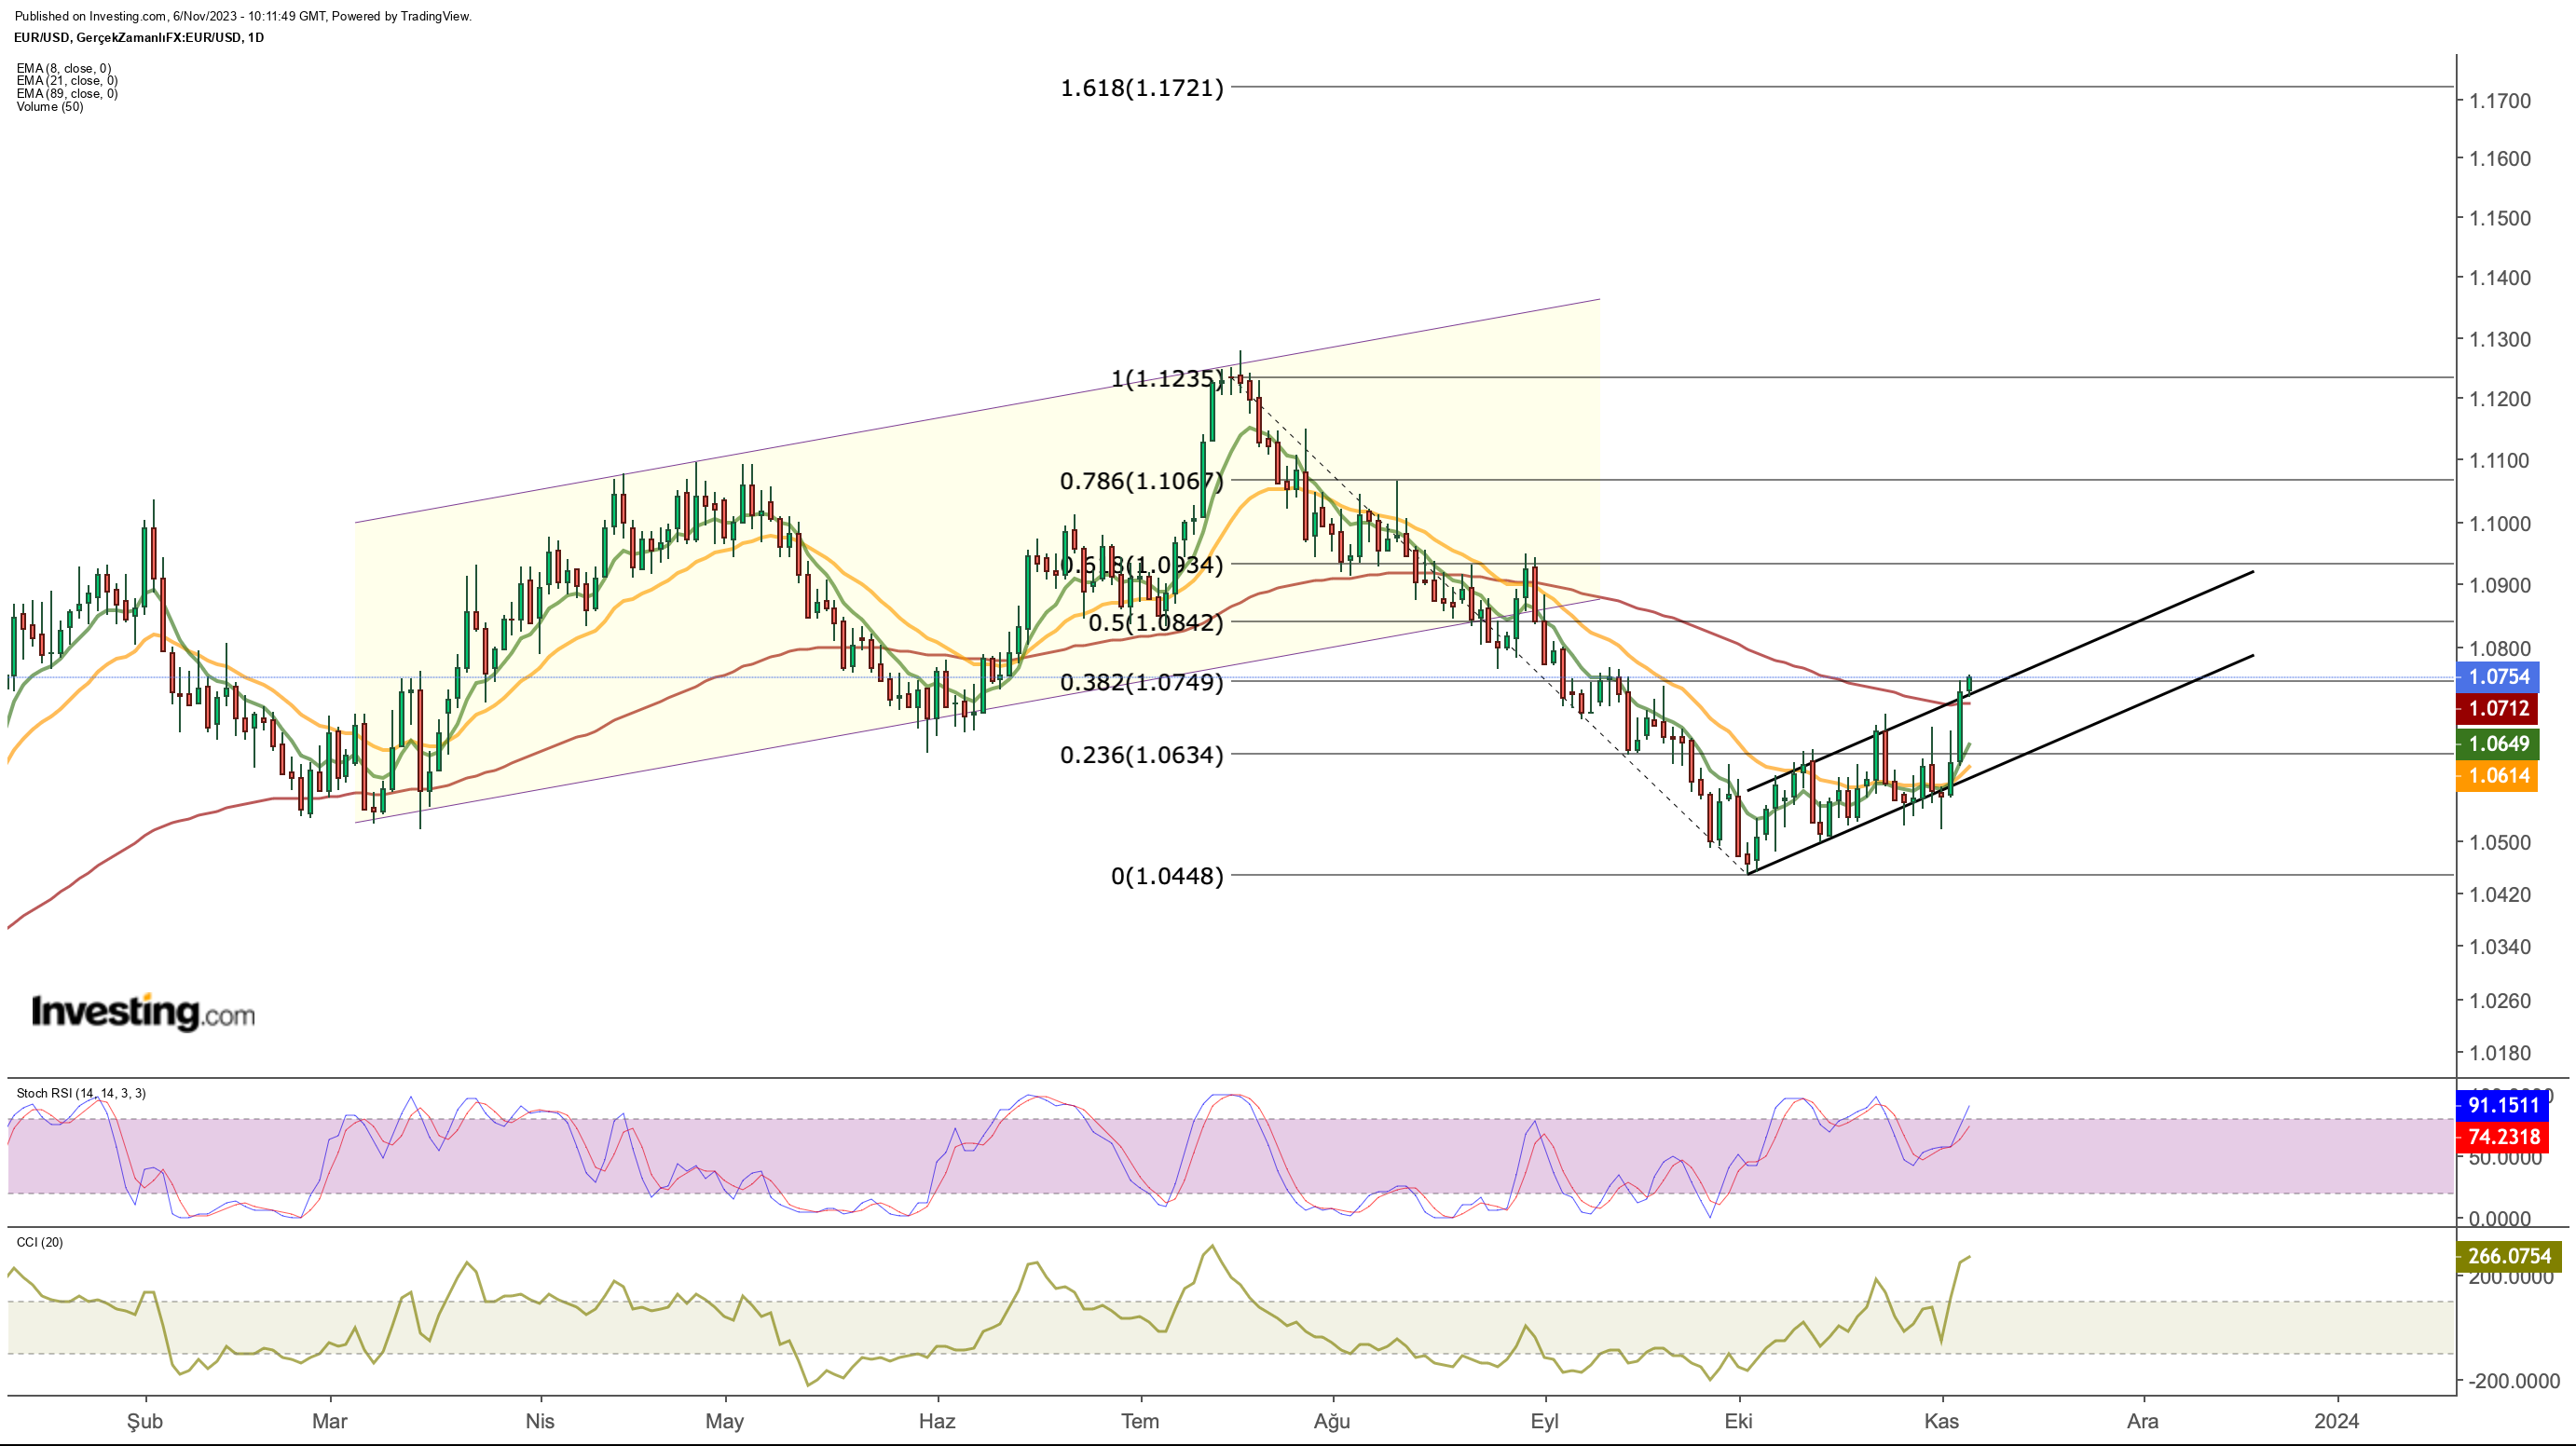
The upward movement that began from the lows in early October continues within the short-term ascending channel. Last Friday, there was a significant jump, amounting to 1% in the pair, resulting in a weekly close at the 1.07 level. This has strengthened the recovery outlook for EUR/USD, as it closed the week above the upper boundary of the rising channel and the 3-month EMA value.
This week, the nearest support to watch for EUR/USD is at 1.07. If daily closings remain above the 1.075 level, we might anticipate the momentum to persist toward the range of 1.085 to 1.09.
Gold Continues Trading Sideways
Gold, unlike other major currencies, is unable to capitalize on the weakness of the dollar and the decline in bond yields. Last month, gold saw an uptick due to increased geopolitical risk, but in parallel with the diminishing perception of geopolitical risk, it has taken a pause in its ascent as investors have been exploring riskier assets.
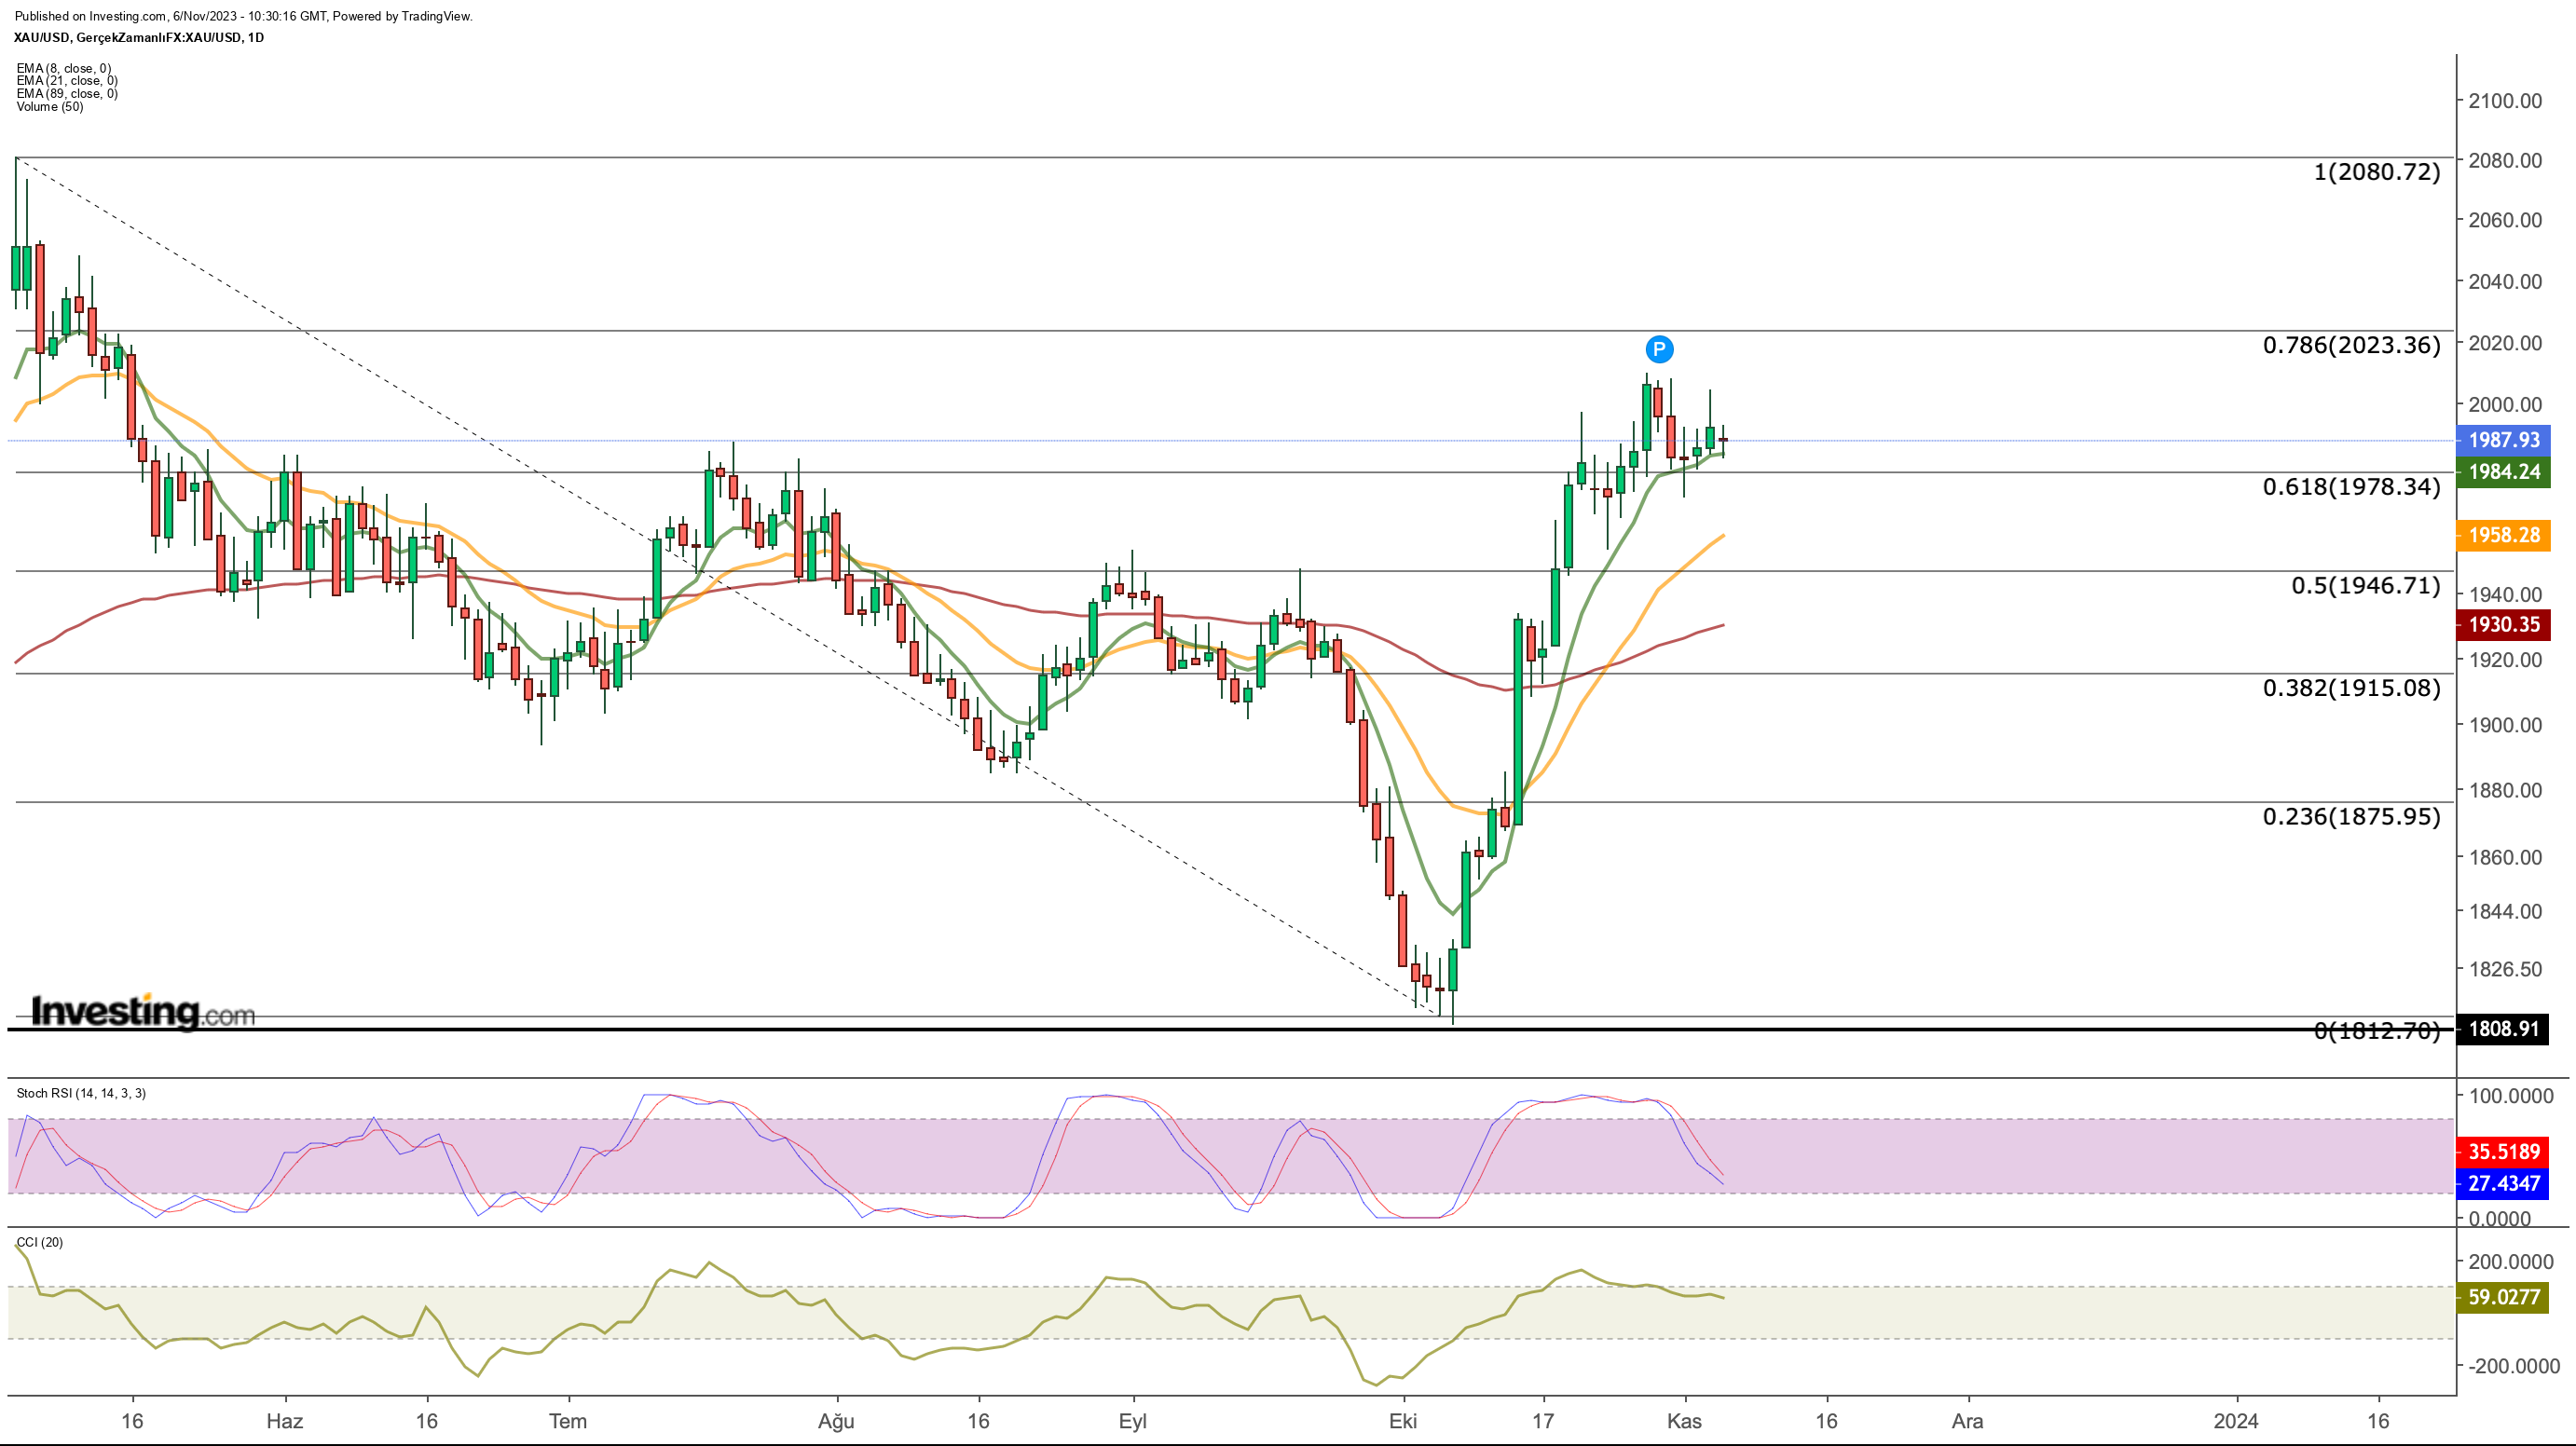
Furthermore, the preservation of the $1,980 support in gold indicates that investors are exercising caution and refraining from substantial selling. If the conflicts in the Middle East do not expand regionally, we might expect the gold market to maintain its sideways trajectory.
As seen in the daily chart, gold continues to hold its position above the average $1,980 support, with the $2,000 level still in focus. In the event that the $1,980 support is breached, a second support could potentially form around $1,950. Below this support, there may be a fluctuation in the range of $1,920 to $1,950.
Oil Keeps Heading Lower Despite Mideast Turmoil
Despite the ongoing conflict in the Middle East, oil futures continue to exhibit a downward trend. This can be seen as a significant indicator signaling that the current risk in the region is under control.
So far, the absence of supply disruptions in the oil market, signs of economic weakness in the United States, and an increase in oil inventories can be considered as the primary factors supporting the downward trend in oil prices.
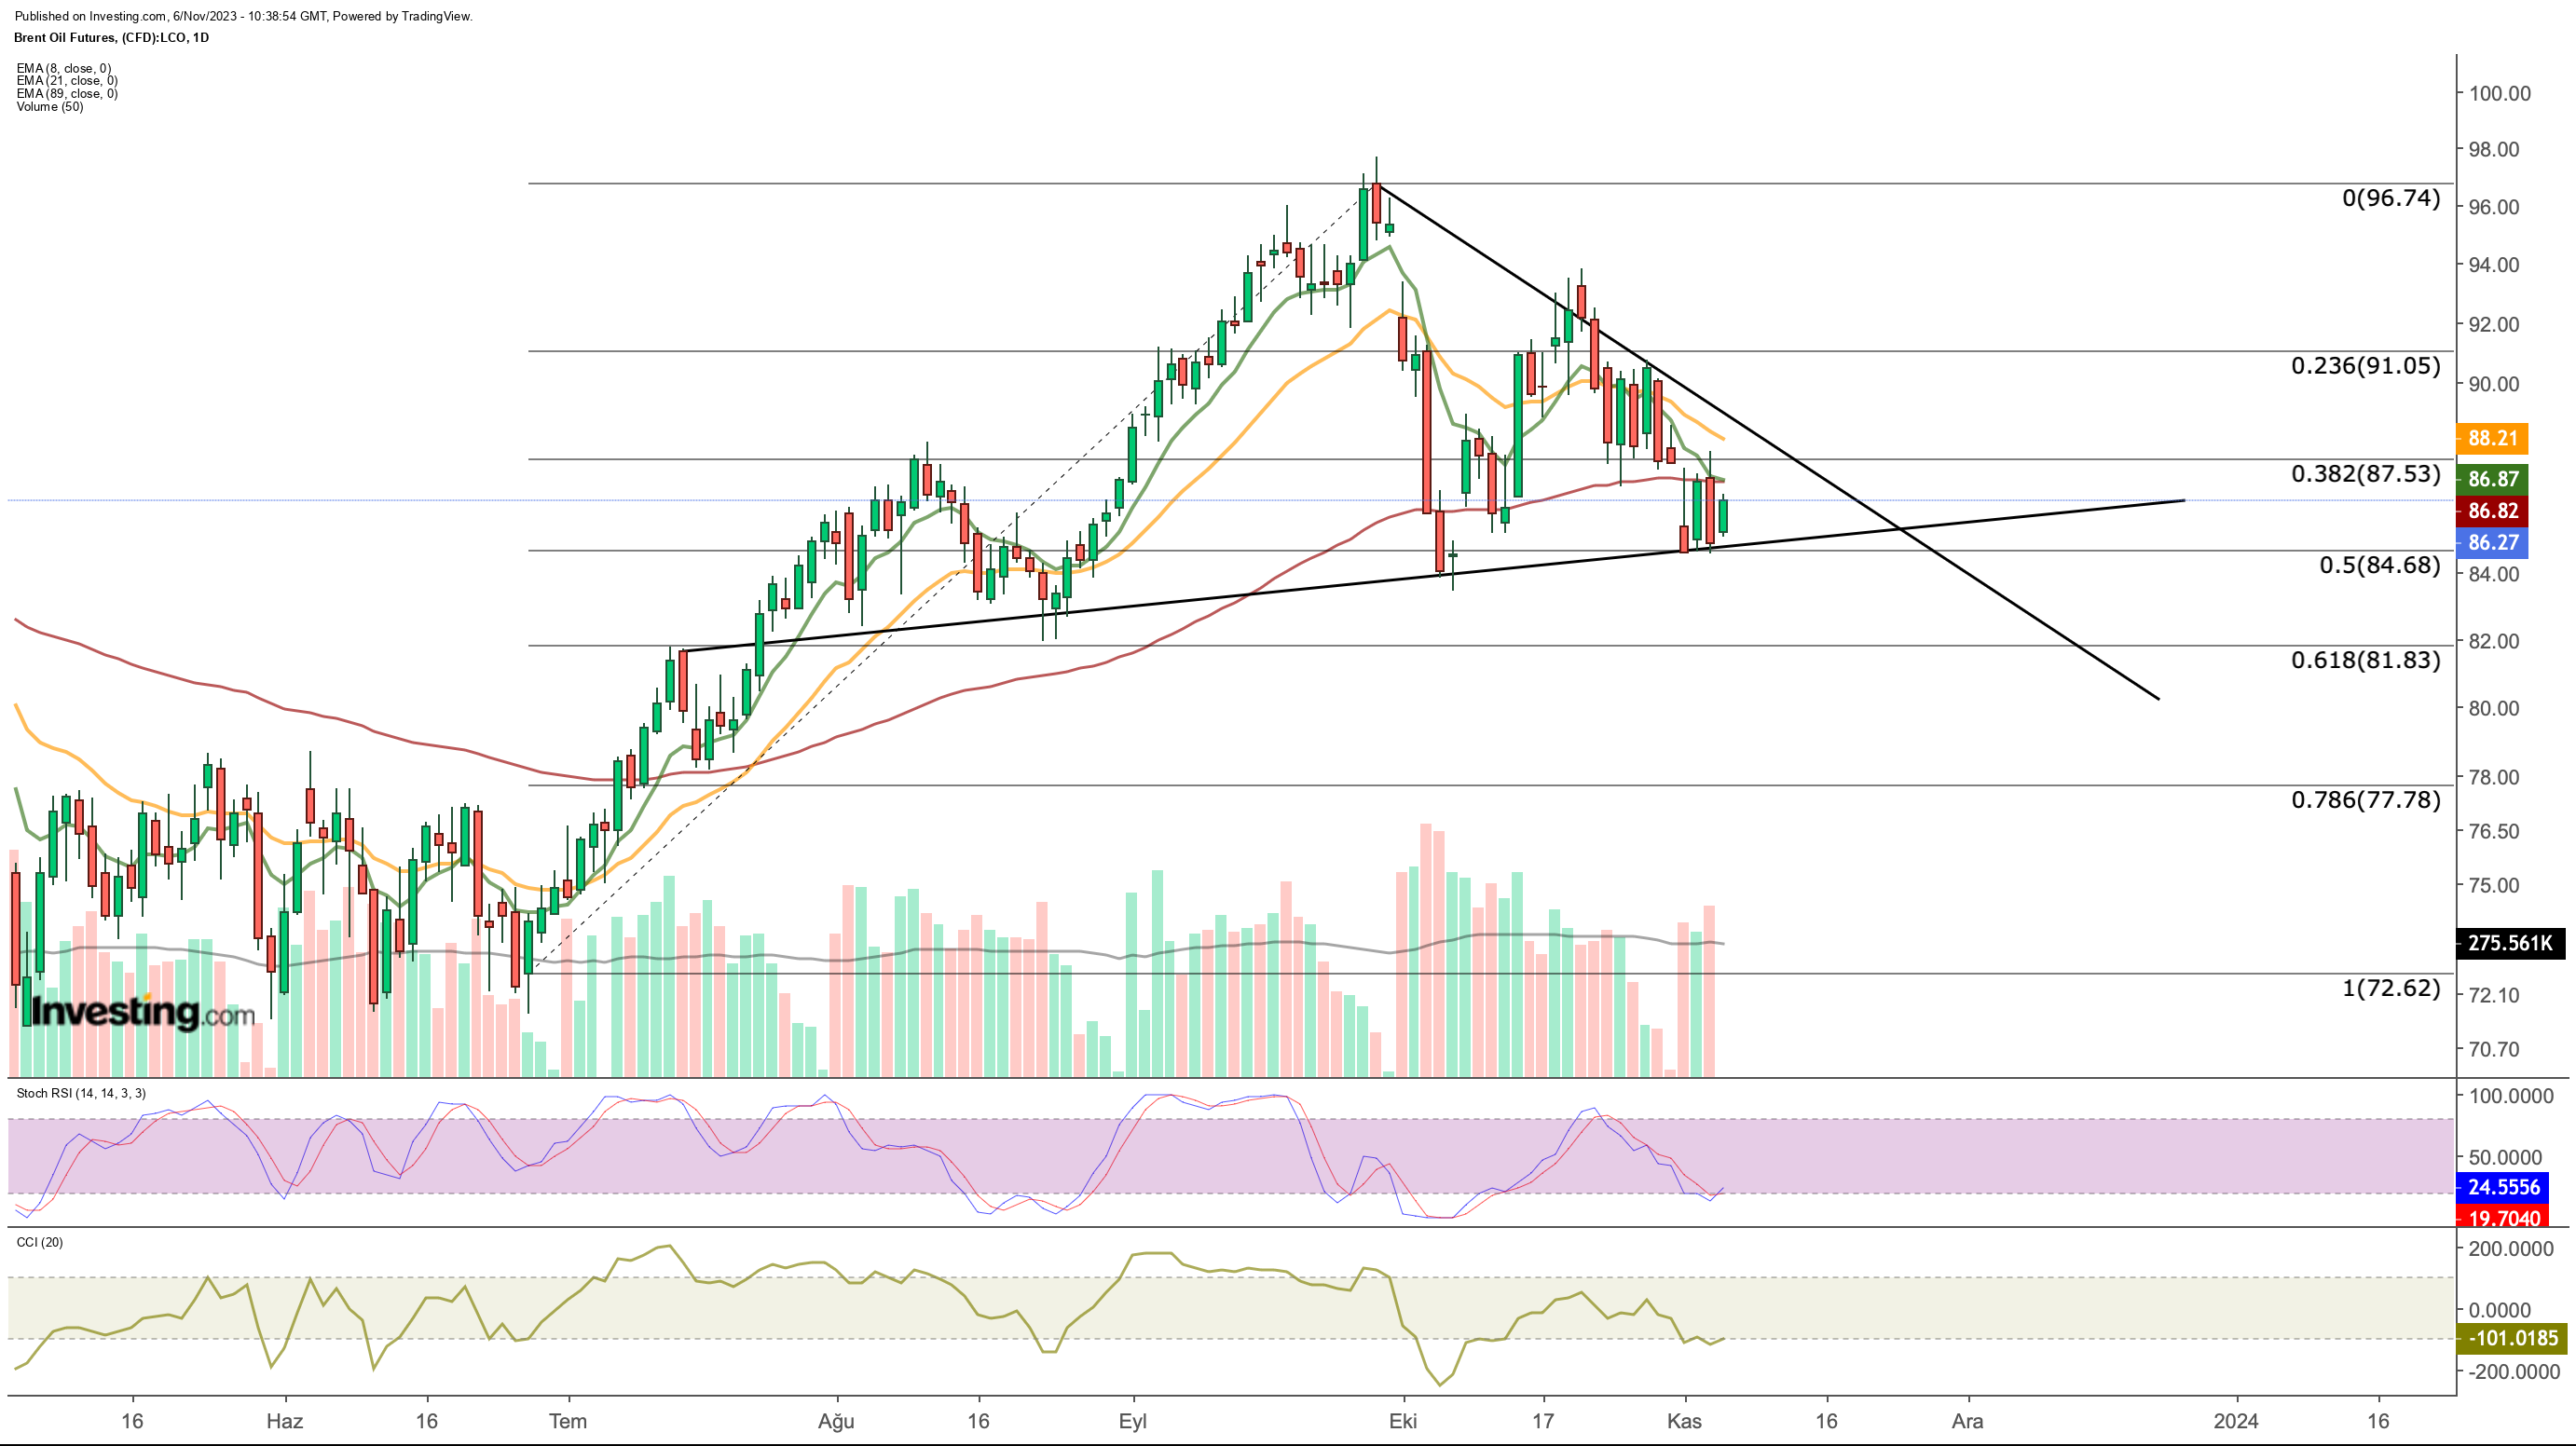
Brent crude oil futures retraced below $85 last week, slowing down their decline at the short-term support trendline. Based on the current situation, the next support level for Brent crude oil appears to be around an average of $81, while the breach of the $87 level can be monitored as a price level that could trigger an upturn.
This week, while economic data is expected to be weak, several Federal Reserve members, including Powell, are scheduled to speak, which could create a volatility-inducing effect in the markets.
If Federal Reserve officials continue to convey the message that there is a pause in interest rate hikes, the downward pressure on the dollar may persist. In such a scenario, demand for the stock market could continue alongside riskier currencies.
***
Disclaimer: This article is written for informational purposes only; it does not constitute a solicitation, offer, advice, or recommendation to invest as such it is not intended to incentivize the purchase of assets in any way. I would like to remind you that any type of asset, is evaluated from multiple points of view and is highly risky and therefore, any investment decision and the associated risk remains with the investor.

