It’s a good news day. Much relief will be felt from a number of retail investors who have been confused as to the very crux of the sell-off in global equity markets.
To be fair, most institutional traders have had a hard time trying to understand exactly what the genuine cause behind the sell-off and ramp up in volatility was, and by–and-large traders could pick one of five key macro catalysts. The latest reasoning is that volatility was actually caused by humans and not algorithmic reasons, or more appropriately high-frequency traders, which of course are easy to blame when markets are falling. Funnily enough, these systematic, rule-based systems don’t get blamed when markets are rising.
Either way, there is a sea of green on screen in risk associated assets. One of the more interesting issues in US trade was a move higher in two-year US bond yields (currently 73 basis points); however, the implied probability of a September hike from the Federal Reserve fell two percentage points to 28% – this has ultimately seen a 34% improvement in US financial conditions. Very positive for overall risk sentiment.
Once again, this pick-up in sentiment once again started from a nice move higher in S&P futures during Asia, helped on by some really bullish flow in the Chinese markets. Specifically, the H-shares (Chinese dual-listed companies trading in Hong Kong) had its best day in months. In the Chinese mainland, there has been some focus on headlines on a 50% reduction in personal income tax dividends for larger shareholders, with the idea being to move the market away from short-term and focus on the longer-term. I suspect there would have been some buying from the Stabilisation Fund as well, but the poor trade balance has clearly been overlooked.
The ASX 200 is likely to see an open 0.5% stronger today at 5142. While this seems meagre, it’s important to keep in mind that S&P 500 futures were fairly well bid at the close of the Australian cash market, so the Aussie market has priced in an element of the overnight rally. S&P futures are still 1.5% higher from the 4.00pm AEST close, suggesting we will still underperform the lead from Wall Street. A nice move higher in the banking sector would be welcome by the bulls and push the ASX 200 closer to the key line in the sand – 5305, the 28 August high. Naturally, this won’t come into play today.
BHP (NYSE:BHP) looks set to open around the AUD $25.00 area (+1.2%), underpinned by some strong moves in oil (up 3.4% from 4.00pm cash close), copper (+4.4%) and iron ore futures (+4.4% in the overnight session). BHP should give us a proxy of the overall resource space, but the price action in the energy space will get a key look in again today.
The fact that Oil Search Ltd (ASX:OSH) closed at AUD $7.90, and therefore a 3.3% premium to the implied offer from Woodside Petroleum Ltd (ASX:WPL), suggests the market is expecting a fresh bid to emerge at some stage. A less opportunistic bid price is obviously open to debate, but those in OSH are there because of the implied 33% earnings growth in 2016 to 2017 and will be prepared to overlook the near-term weakness in the oil price. You are not going to get the same sort of growth in many other oil plays, specifically WPL. If you take a longer-term stance on OSH and believe earnings assumptions are correct, then a two-year forward P/E multiple at 12x isn’t overly demanding. Shareholders will want something in excess of AUD $9.00, and even into AUD $10.00.
Either way, the mergers and acquisitions moves in the space should push the likes of Beach Energy Ltd (ASX:BPT) and Santos Ltd (ASX:STO) around again today.
Other factors to consider:
Will we see a further pick-up in Westpac’s consumer confidence read at 10.30am AEST? Or will we see consumers being affected by the 14% sell-off in the ASX 200 throughout August, with the ASX volatility index pushing into 30%?
Given all the rhetoric around Aussie housing of late, home loan data out at 11.30am AEST will also be of interest.
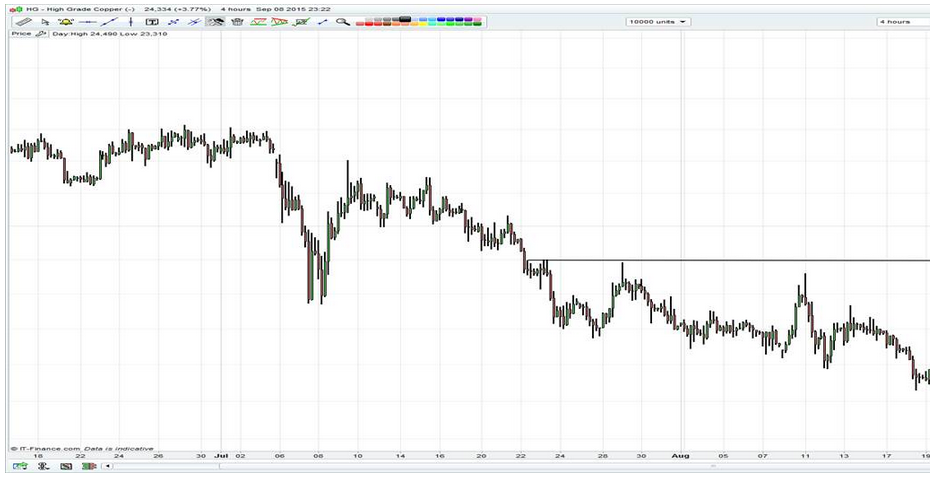
I have been focusing on the bullish price action in copper lately (see below) and despite a poor China trade balance, we have seen a further bullish move. As you can see on the four-hour chart, copper is testing the top of the rising channel and series of highs from July. A break of $2.45 per pound would be very positive and presumably lift sentiment in markets generally – ‘Dr Copper’ and all.
AUD/USD continues to hold above the 70 handle, but if one looks at the four-hour chart, strong supply can be seen between $0.7040 to $0.7060. The pair will be hard pushed to break and I would expect traders to fade moves into this region. However, given the level of short positioning, I would continue focussing more on fading moves into $0.7100 and closer to the 38.2% retracement of the August to September sell-off.

