Street Calls of the Week
While we put the first half of September behind us, many investors are wondering whether the recent sell-off is over.
Tech-stocks, many of which now have extremely high price multiples, are in center stage. Does it make sense to remain bullish on these growth stocks? Or is it time to diversify holdings, for example, via exchange-traded funds (ETFs)?
Let's take a closer look:
The Case For A Balanced Portfolio
Thin summer trading has pushed many tech stocks to new all-time highs. As we entered September, markets were frothy. We are among those who believe the recent share-split announcements in Apple (NASDAQ:AAPL) and Tesla possibly marked a top in tech stocks — at least for now.
While we get ready to welcome fall, several risk factors should be on your radar. Short-term developments on the vaccine front and economic numbers that paint a dire picture can affect investors' sentiment weekly, if not daily. A lack of another stimulus package to help the US consumer is another potential setback.
And let's not forget the upcoming US Presidential election. Any potential delay in announcing a winner might easily spook market participants.
Yet we wouldn't encourage long-term investors to panic-sell. Instead, it may be wise to take a step back and re-evaluate portfolios. Depending on the risk/return profile, realizing some of the paper profits and trimming the overvalued names could be appropriate.
While loading up on the hottest stocks can feel tempting, over-exposure to one particular sector can be risky, leading to a stomach-churning ride, especially for retail investors. Instead, a more balanced portfolio can offer protection, especially in volatile times when diversified portfolios reveal their advantages.
While popular names take a breather, it may be worth researching different sectors, which can boost diversification. Against that backdrop, here are our two ETFs for today:
1. Invesco Zacks Multi-Asset Income ETF
- Current Price: $17.18
- 52-week range: $10.95 - $23.57
- Dividend Yield: 4.11%
- Expense Ratio: 0.97% per year, or $97 on a $10,000 investment
The Invesco Zacks Multi-Asset Income ETF (NYSE:CVY) provides exposure to US-listed stocks, American depositary receipts paying dividends, real estate investment trusts (REITs), master limited partnerships, closed-end funds as well as preferred stocks.

CVY, which has 149 holdings, follows the Zacks Multi-Asset Income index. Both the index and the fund are rebalanced quarterly. In terms of country allocation, the US tops the list with over 85%. Next are Brazil, Japan, and Mexico.
The ten largest holdings constitute over 12% of the fund. Top five names are Oasis Midstream Partners (NASDAQ:OMP), Oxford Lane Capital Corp (NASDAQ:OXLC), DoubleLine Income Solutions Fund (NYSE:DSL), USA Compression Partners (NYSE:USAC) and Dominion Energy (NYSE:DCUE).
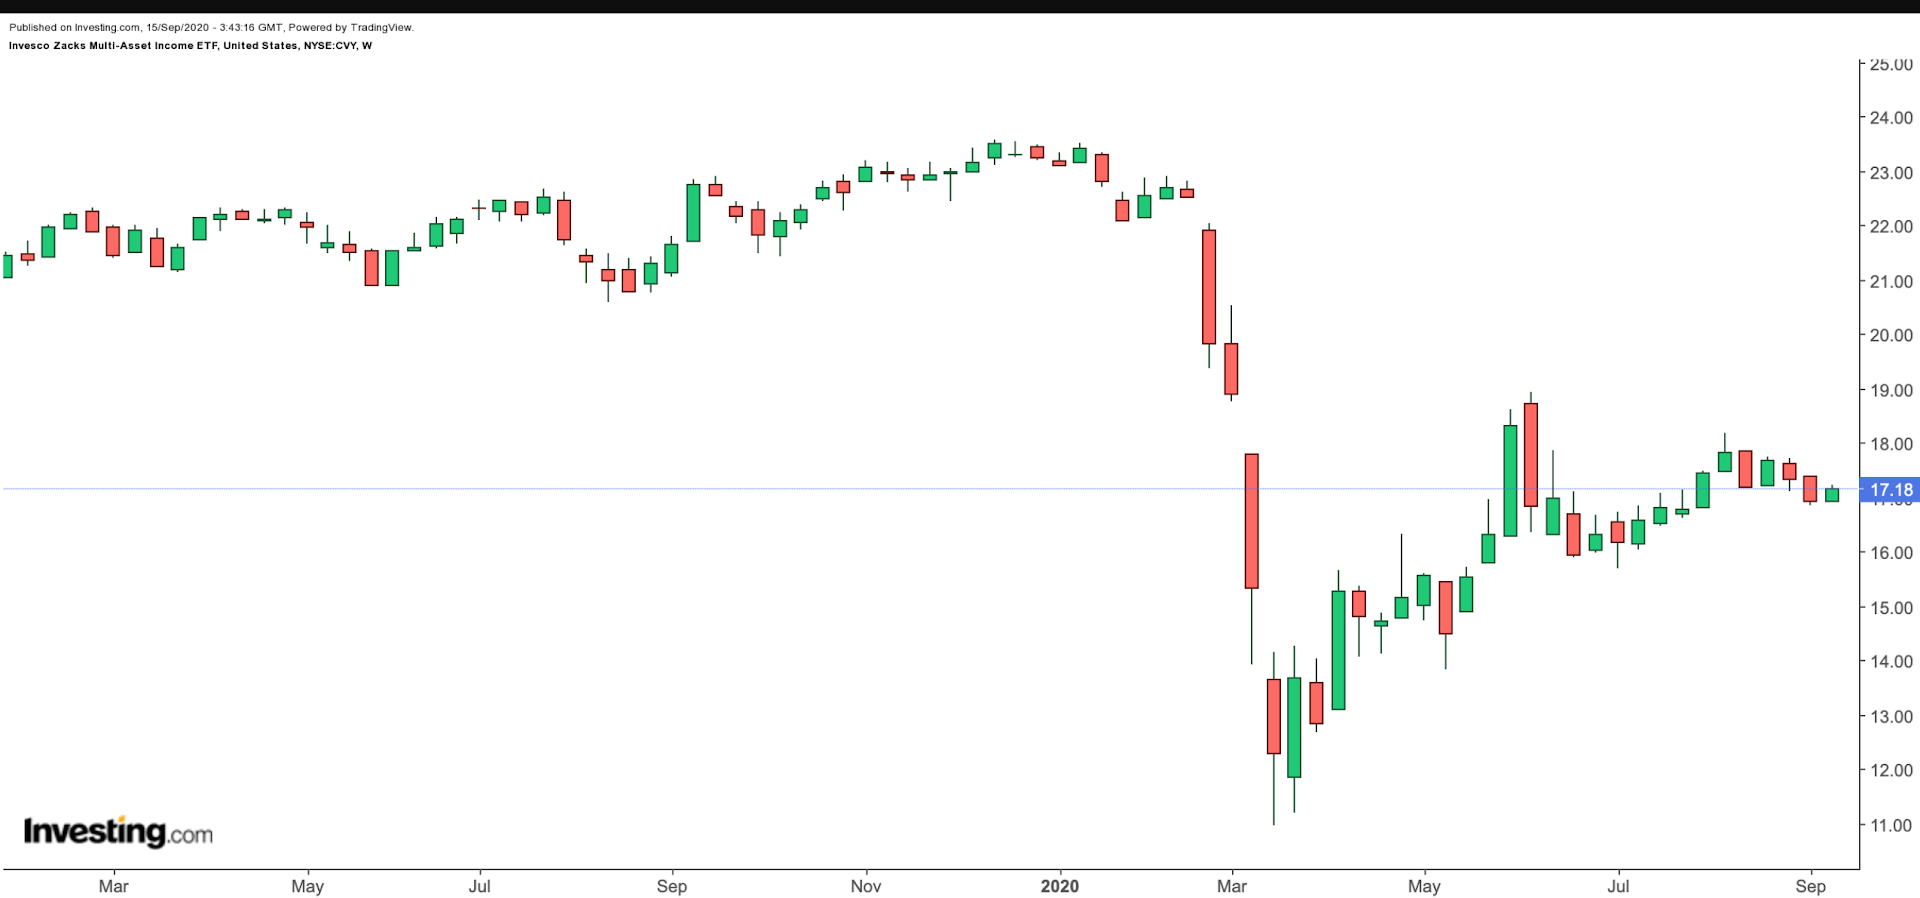
So far in the year, CVY is down close to 27%, but that metric does not include the dividend yield. Following the lows seen in March, the fund has moved up over 50%. In early June, it hit a recent high of $18.93. Since then, profit-taking has kicked in, easing the forward P/E and P/B ratios to 15.55 and 1.06, respectively.
Investors who also pay attention to short-term technical analysis may want to know that a decline toward the $16-level is still possible. Time-price analysis suggests that the fund may stay under short-term pressure through the end of November. Long-term investors may consider buying the dips.
2. Goldman Sachs Hedge Industry VIP ETF
- Current Price: $75.87
- 52-week range: $41.73 - $81.59
- Dividend Yield: 0.31%
- Expense Ratio: 0.45% per year, or $45 on a $10,000 investment.
The Goldman Sachs Hedge Industry VIP ETF (NYSE:GVIP) provides exposure to fundamentally driven hedge fund managers’ most important long equity ideas as well as a range of dynamic market themes. Unlike what its name may imply, the fund is neither a hedge fund nor does it invest in hedge funds.

GVIP, which has 50 holdings, tracks the GS Hedge Fund VIP index. The fund describes these companies as “Very-Important-Positions,” which appear most frequently among their top ten long equity holdings. The top four sectors of the fund include Information Technology (34.1%), Communication Services (23.9%), Consumer Discretionary (18.7%) and Health Care (11.5%).
The fund's net assets are close to $112 million with the ten largest holdings constituting close to 23% of that figure. Top five names are Salesforce.Com (NYSE:CRM), CrowdStrike Holdings (NASDAQ:CRWD), Caesars (NASDAQ:CZR), JD.Com (NASDAQ:JD), and Tesla (NASDAQ:TSLA).
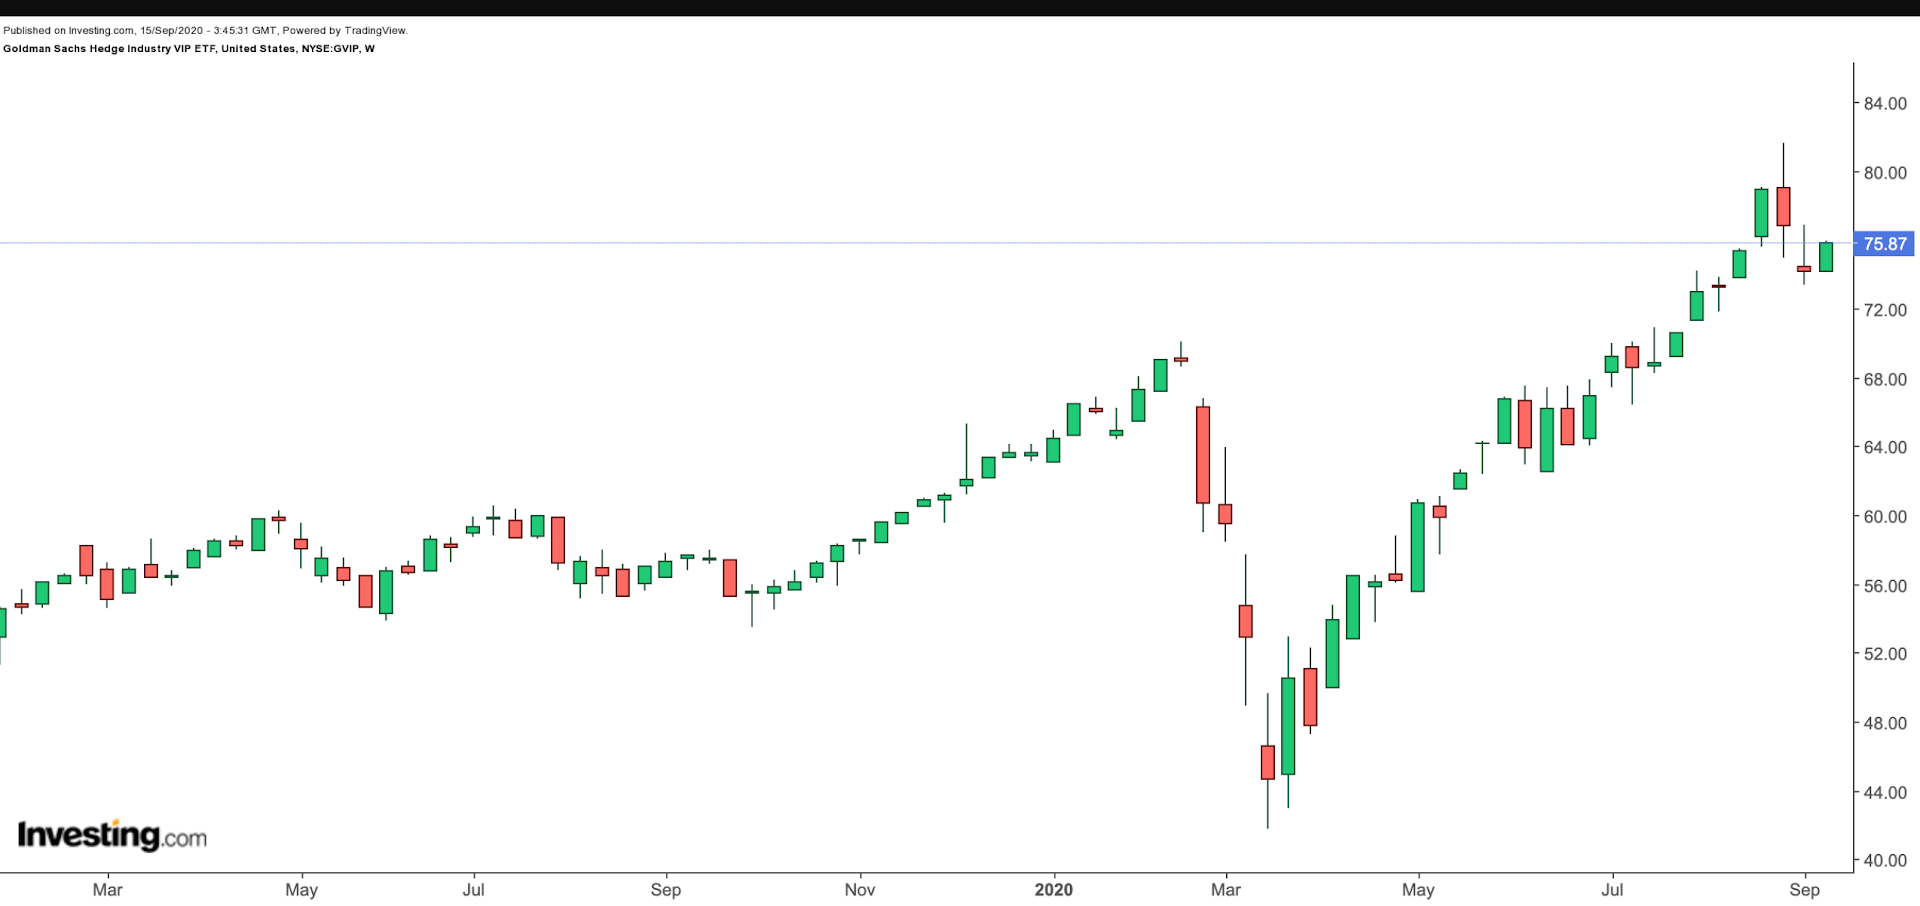
Year-to-date, GVIP is up over 19%. In fact, since the March lows, it is up around 80%. On Sept. 2, the fund hit an all-time high of $81.59. Respective trailing P/E and P/B ratios of 32.16 and 3.86, as well as short-term technical analysis, suggest that a further price drop of 5-7% is possible. A decline toward $72.50 or below would make the fund more attractive for long-term investors.
The Bottom Line
We believe diversification helps retail investors achieve more stable and satisfactory returns both in the short- and long-term. Other ETFs which could be of interest include:
- First Trust Nasdaq Food & Beverage ETF (NASDAQ:FTXG)
- Global X Silver Miners ETF (NYSE:SIL) (covered here)
- Global X SuperDividend® REIT ETF (NASDAQ:SRET)
- Health Care Select Sector SPDR® Fund (NYSE:XLV) (covered here)
- Invesco Optimum Yield Diversified Commodity Strategy No K-1 ETF (NASDAQ:PDBC) (covered here)
- IQ Hedge Multi-Strategy Tracker ETF (NYSE:QAI)
- iShares Core Moderate Allocation ETF (NYSE:AOM)
- iShares Global Infrastructure ETF (NASDAQ:IGF) (covered here)
- Global X NASDAQ 100 Covered Call ETF (NASDAQ:QYLD) (covered here)
- SPDR® Gold Shares (NYSE:GLD) (covered here)
- VanEck Vectors Pharmaceutical ETF (NASDAQ:PPH)
- Vanguard Dividend Appreciation Index ETF (NYSE:VIG) (covered here)
- Vanguard Total International Stock Index Fund ETF Shares (NASDAQ:VXUS)
We plan to revisit the topic of diversification in the coming weeks.
