Gold – Thursday 30 July 2015
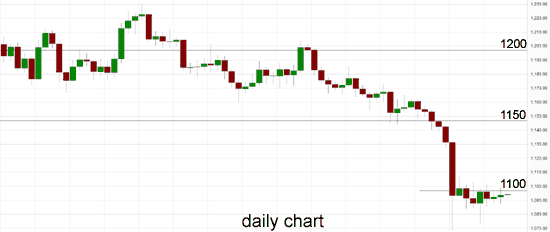
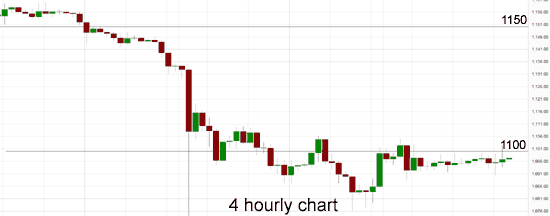
Throughout the last month gold has steadily declined and fallen from above the key $1200 level back to a new five year low below $1100 earlier last week. Earlier last week, gold fell sharply through the $1100 level down to the multi-year low near $1070 before rallying back up towards $1100. It is presently consolidating in a narrow range below $1100 and meeting resistance there. A couple of weeks ago, it enjoyed solid support from the $1150 level, which stopped the sharp falls and allowed it to rally a little higher up to above $1160. During this time, it has rallied higher but run into resistance at $1160, which has sent it much lower again. To finish out, a few weeks ago it was able to rally against the medium term down trend and move back above the $1170 level before easing off again. A few weeks ago, it surged higher to back above the key $1180 level before easing lower again.
Should it rally back higher in the foreseeable future, the $1200 level remains significant as it provided ample resistance to higher prices for an extended period. A couple of months ago gold fell sharply back through the key $1200 level and spent the remainder of that week consolidating in a narrow range around $1190. The $1200 level has been a significant level throughout most of this year and remains a key level presently offering reasonable resistance to higher prices, whilst lower the $1180 level continues to be significant. It will be some effort just to get back within reach of the $1200 level after its recent strong falls.
Earlier in May, it was able to make a run through the $1200 level to reach a three month high above $1230 however gold was quickly sold off and returned back to the $1200 level where it enjoyed some support for several days. For around two months through April, gold traded in a range between $1180 and around $1220 and had very few excursions outside these limits. Gold is currently pinned between resistance at $1200 and support at $1180 and it is surprising to see it trade in such a narrow range for several days. It seems it is waiting patiently for external factors to determine which level will be severely tested next.
Gold July 30 at 00:35 GMT 1097.4 H: 1102.1 L: 1090.5
Gold Technical
| S3 | S2 | S1 | R1 | R2 | R3 |
| — | — | — | 1100 | 1200 | 1240 |
During the early hours of the Asian trading session on Thursday, Gold is trading in a narrow range just below $1100 after recently dropping to a new multi-year low near $1070.
Further levels in both directions:
• Below:
• Above: 1100, 1200 and 1240.
OANDA’s Open Position Ratios
(Shows the ratio of long vs. short positions held for Gold among all OANDA clients. The left percentage (blue) shows long positions; the right percentage (orange) shows short positions.)
The long position ratio for Gold has moved back to above 65% as Gold has dropped sharply to below the $1100 level. The trader sentiment is strongly in favour of long positions.
Economic Releases
-
- 23:30 (Wed) JP CPI Core (Nation) (Jun)
- 23:30 (Wed) JP CPI Core (Tokyo) (Jul)
- 23:30 (Wed) JP Real Household Spending (Jun)
- 23:30 (Wed) JP Unemployment (Jun)
- 01:30 AU Import & Export price index (Q2)
- 01:30 AU Building approvals (Jun)
- 09:00 EU Business Climate Index (Jul)
- 09:00 EU Consumer Sentiment (Jul)
- 09:00 EU Economic Sentiment (Jul)
- 09:00 EU Industrial Sentiment (Jul)
- 12:30 US Core PCE Price Index (1st Est.) (Q2)
- 12:30 US GDP Annualised (1st Est.) (Q2)
- 12:30 US GDP Price Index (1st Est.) (Q2)
- 12:30 US Initial Claims (25/07/2015)


