All eyes on Japan this morning with talk of a ¥20 trillion stimulus package through a supplementary budget. Recent press has been centred on a ¥10 trillion package and if true would clearly be a sign of intent from the Abe government, although most economists would still stress that genuine reform still needs to be addressed to really put Japan on the right path.
One can look at a number of risk and sentiment indicators to show markets are just way to cool for school. The US volatility index (or the ‘VIX’) is at the lowest levels of the year and below 12 highlights that expected moves over the coming 30 days are basically non-existent. Not great for the traders, but these are conditions we need to adapt to.
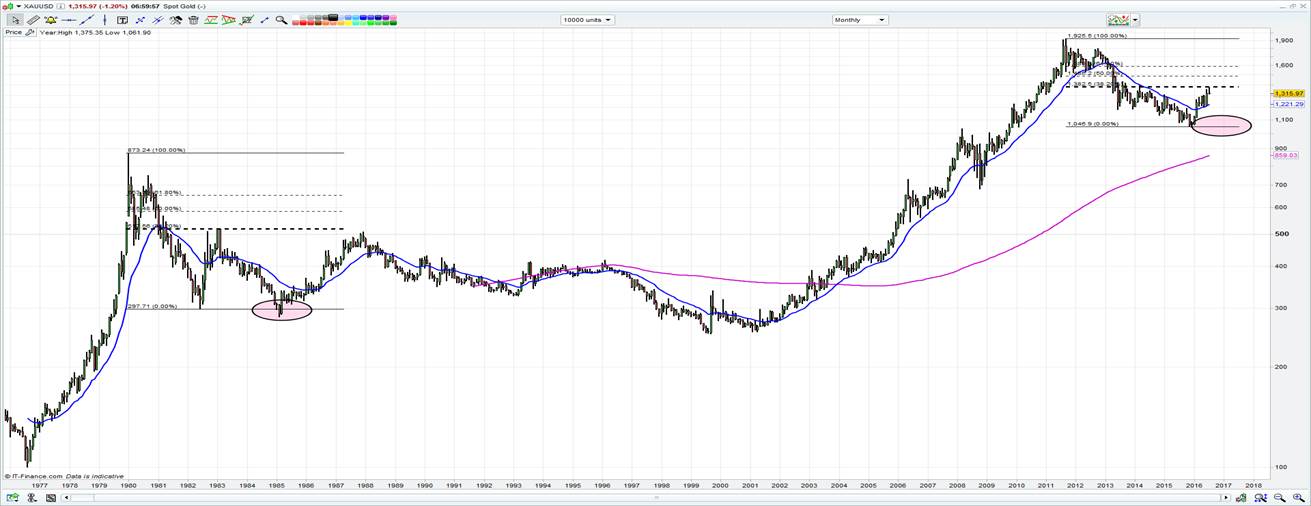
Gold prices look like they are heading lower and specifically I am now targeting $1250 (or a move or around 5%) and I sit in the camp that the highs have been seen in this move in gold and we could see $1100 and even a re-test of the 2015 low of $1046 over time. Certainly if history is to repeat the set-up looks remarkably like that of the moves we saw in the early 1980’s.

We continue to see huge inflows into the emerging market ETF (iShares MSCI Emerging Markets (NYSE:EEM)) and high yield ETF (iShares iBoxx $ High Yield Corporate Bond (NYSE:HYG)) and both look delicately poised to break recent consolidation patterns on the daily charts.
The S&P 500, itself continues to make new highs, backed by better than expected corporate earnings. While we have only seen 16% of US firms report, 78% have beaten expectations on earnings and 60% on sales. Those that have beaten on the EPS line have done so by an average of 5.6% and while there is still a large percentage of names to report traders are extrapolating out across the curve.
The Dow has made seven consecutive highs, a fate that hasn’t been seen since March 2013 and traders are even asking whether we could genuinely see a rate hike this year from the Fed. Certainly the interest rate market now sees a hike by December at 50:50 and the feedback loop of higher equity markets, tighter corporate credit spreads and increased chance of rate hikes continues in earnest.
So we have better corporate earnings, likely bold fiscal stimulus in Japan, zero interest rates helping to absorb every macro shock we hear about and broad monetary easing likely from the RBNZ, RBA, BoE, ECB and BoJ.
What could possibly go wrong? If equity markets can’t rally in this environment they never will and really the key concern holding back fresh capital is significantly elevated valuations.
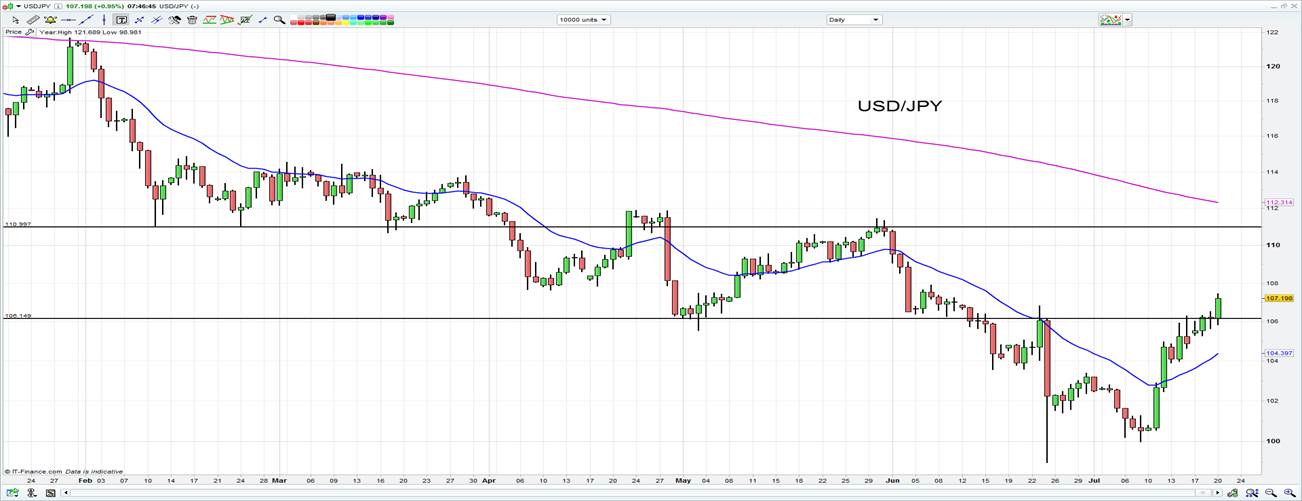
Turning to the Asian open and the fact USD/JPY has had such a bullish move in the twilight zone (between US close and Asia open) should be positive for the Nikkei and inject fresh confidence into the region.
Not that it really needs it with the Hang Seng also looking super bullish too. The ASX 200 is likely to open at 5515, with domestic plays working as they did yesterday, with banks and healthcare the likely hunting grounds for the bulls. There seems to be a rotation out of material names and into healthcare and banks and I can’t see this changing straight away.

