Commodities have been getting significant attention in recent weeks, and possibly for good reason. The Federal Reserve, as well as many other central banks, is likely to keep interest rates at their current low levels for the foreseeable future. Meanwhile, fiscal stimulus measures and the reopening of economies will likely create inflationary pressures.
Higher inflation typically changes the tone of the market, including which asset classes do better than others. Most investors tend to add exposure to commodities for diversification, especially during inflationary times.
We previously discussed several commodity-focused exchange-traded funds (ETFs), including aluminum, base metals, copper, gold and silver. Today, we extend the discussion to two other ETFs that might be appropriate for market participants who believe commodities will show a period of outperformance in the quarters to come.
1. VanEck Vectors Agribusiness ETF
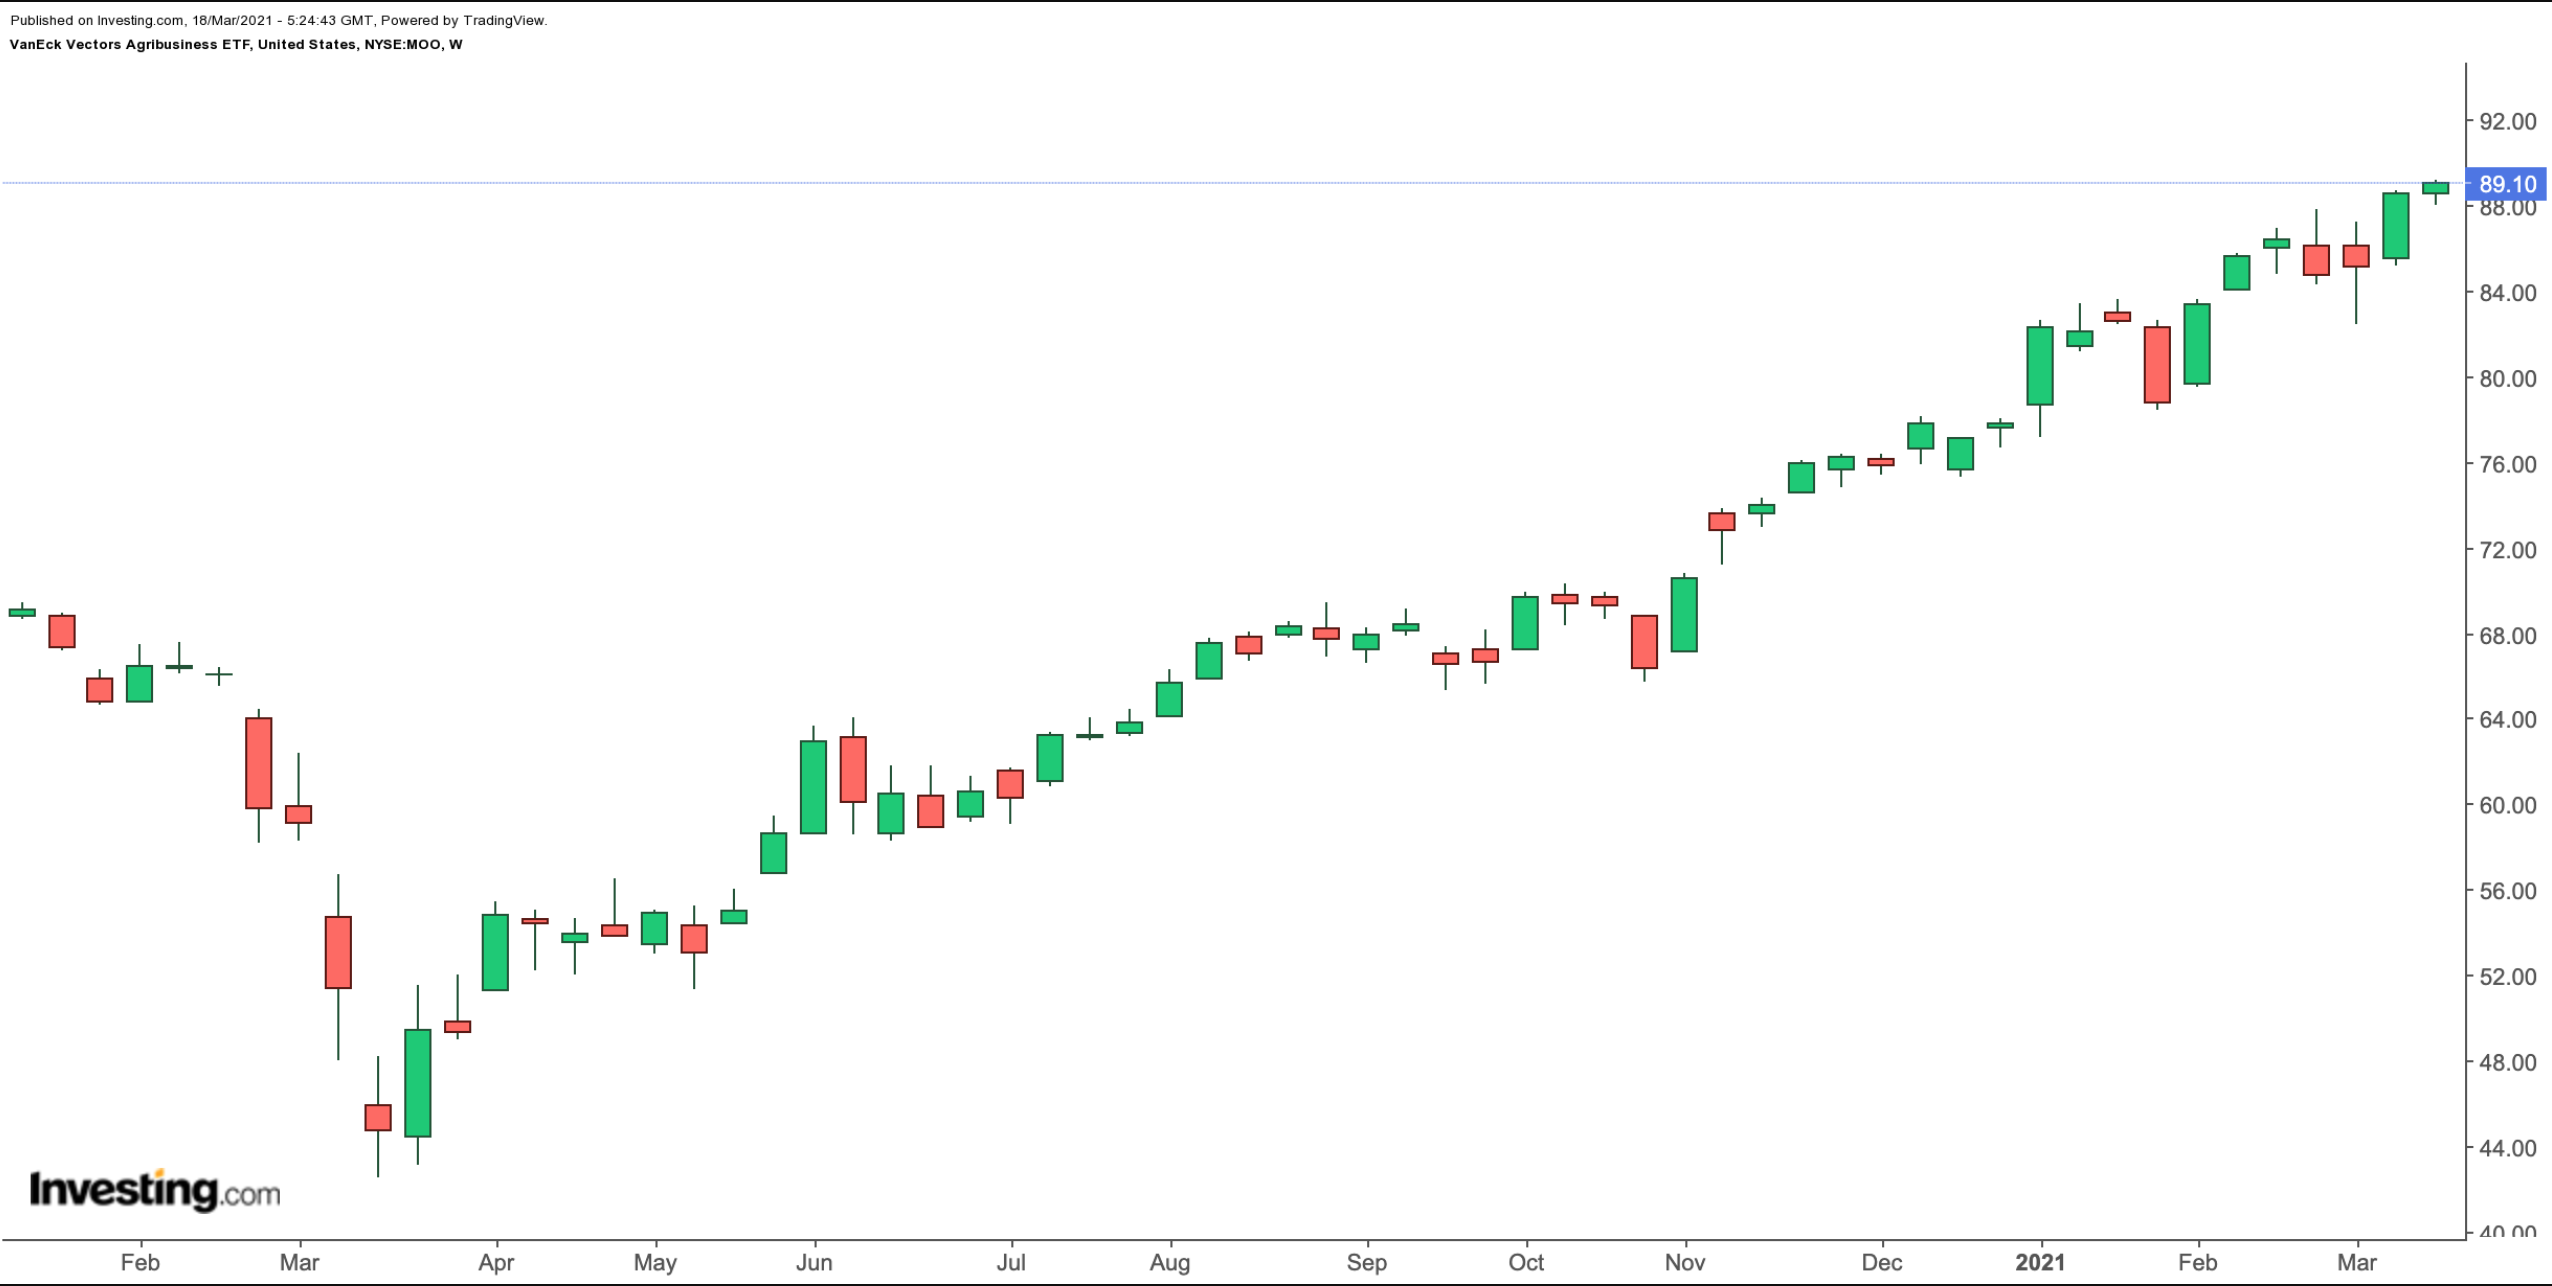
Current Price: $89.10
52-Week Range: $42.52 - $89.19
Dividend Yield: 0.97%
Expense Ratio: 0.56% per year
This fund is an indirect play on agricultural commodities—“staple crops and animals produced or raised on farms or plantations.” Recent metrics highlight:
“26.7% of the world’s population are involved in farming these agricultural commodities. That is over 2 billion people, with nearly 900 million directly employed across the world’s 570 million farms.”
The VanEck Vectors Agribusiness ETF (NYSE:MOO) gives access to businesses involved in agri-chemicals, animal health, fertilizers, seeds, farm equipment, aquaculture, livestock, trading of agricultural products and plantations—such as grains, oil palms, sugar cane, tobacco leaves and grapevines.

MOO, which tracks the MVIS Global Agribusiness Index, includes 52 stocks. The top 10 holdings constitute more than 57% of the fund's total net assets of $1.1 billion. The fund started trading in August 2007.
Among the largest holdings are Deere (NYSE:DE), which manufactures agriculture, construction and forestry equipment; life sciences groups Zoetis (NYSE:ZTS); and IDEXX Laboratories (NASDAQ:IDXX), which specialize in animal health; and Bayer (DE:BAYGN) (OTC:BAYRY), which also has important animal health operations.
In terms of country weightings, the U.S. tops the list, with almost 56%, followed by Germany, Canada, Japan and China. The most significant sectors (by weighting) are consumer staples (28.1%), materials (23.4%), health care (22.9%) and industrials (22.0%).
In the past 12 months, MOO is up about 86% and hit an all-time high in mid-March. Therefore, short-term profit-taking is likely.
However, agricultural produce feeds all of us and agricultural commodities also have industrial uses. It is likely that the opening of global economies in the coming months will increase the demand for these commodities. For instance, the opening of restaurants will support prices of agricultural commodities.
Furthermore, inflation is typically bullish for raw materials. Therefore, any potential decline in the price of MOO could be an opportunity to invest in the fund.
2. Global X Uranium ETF
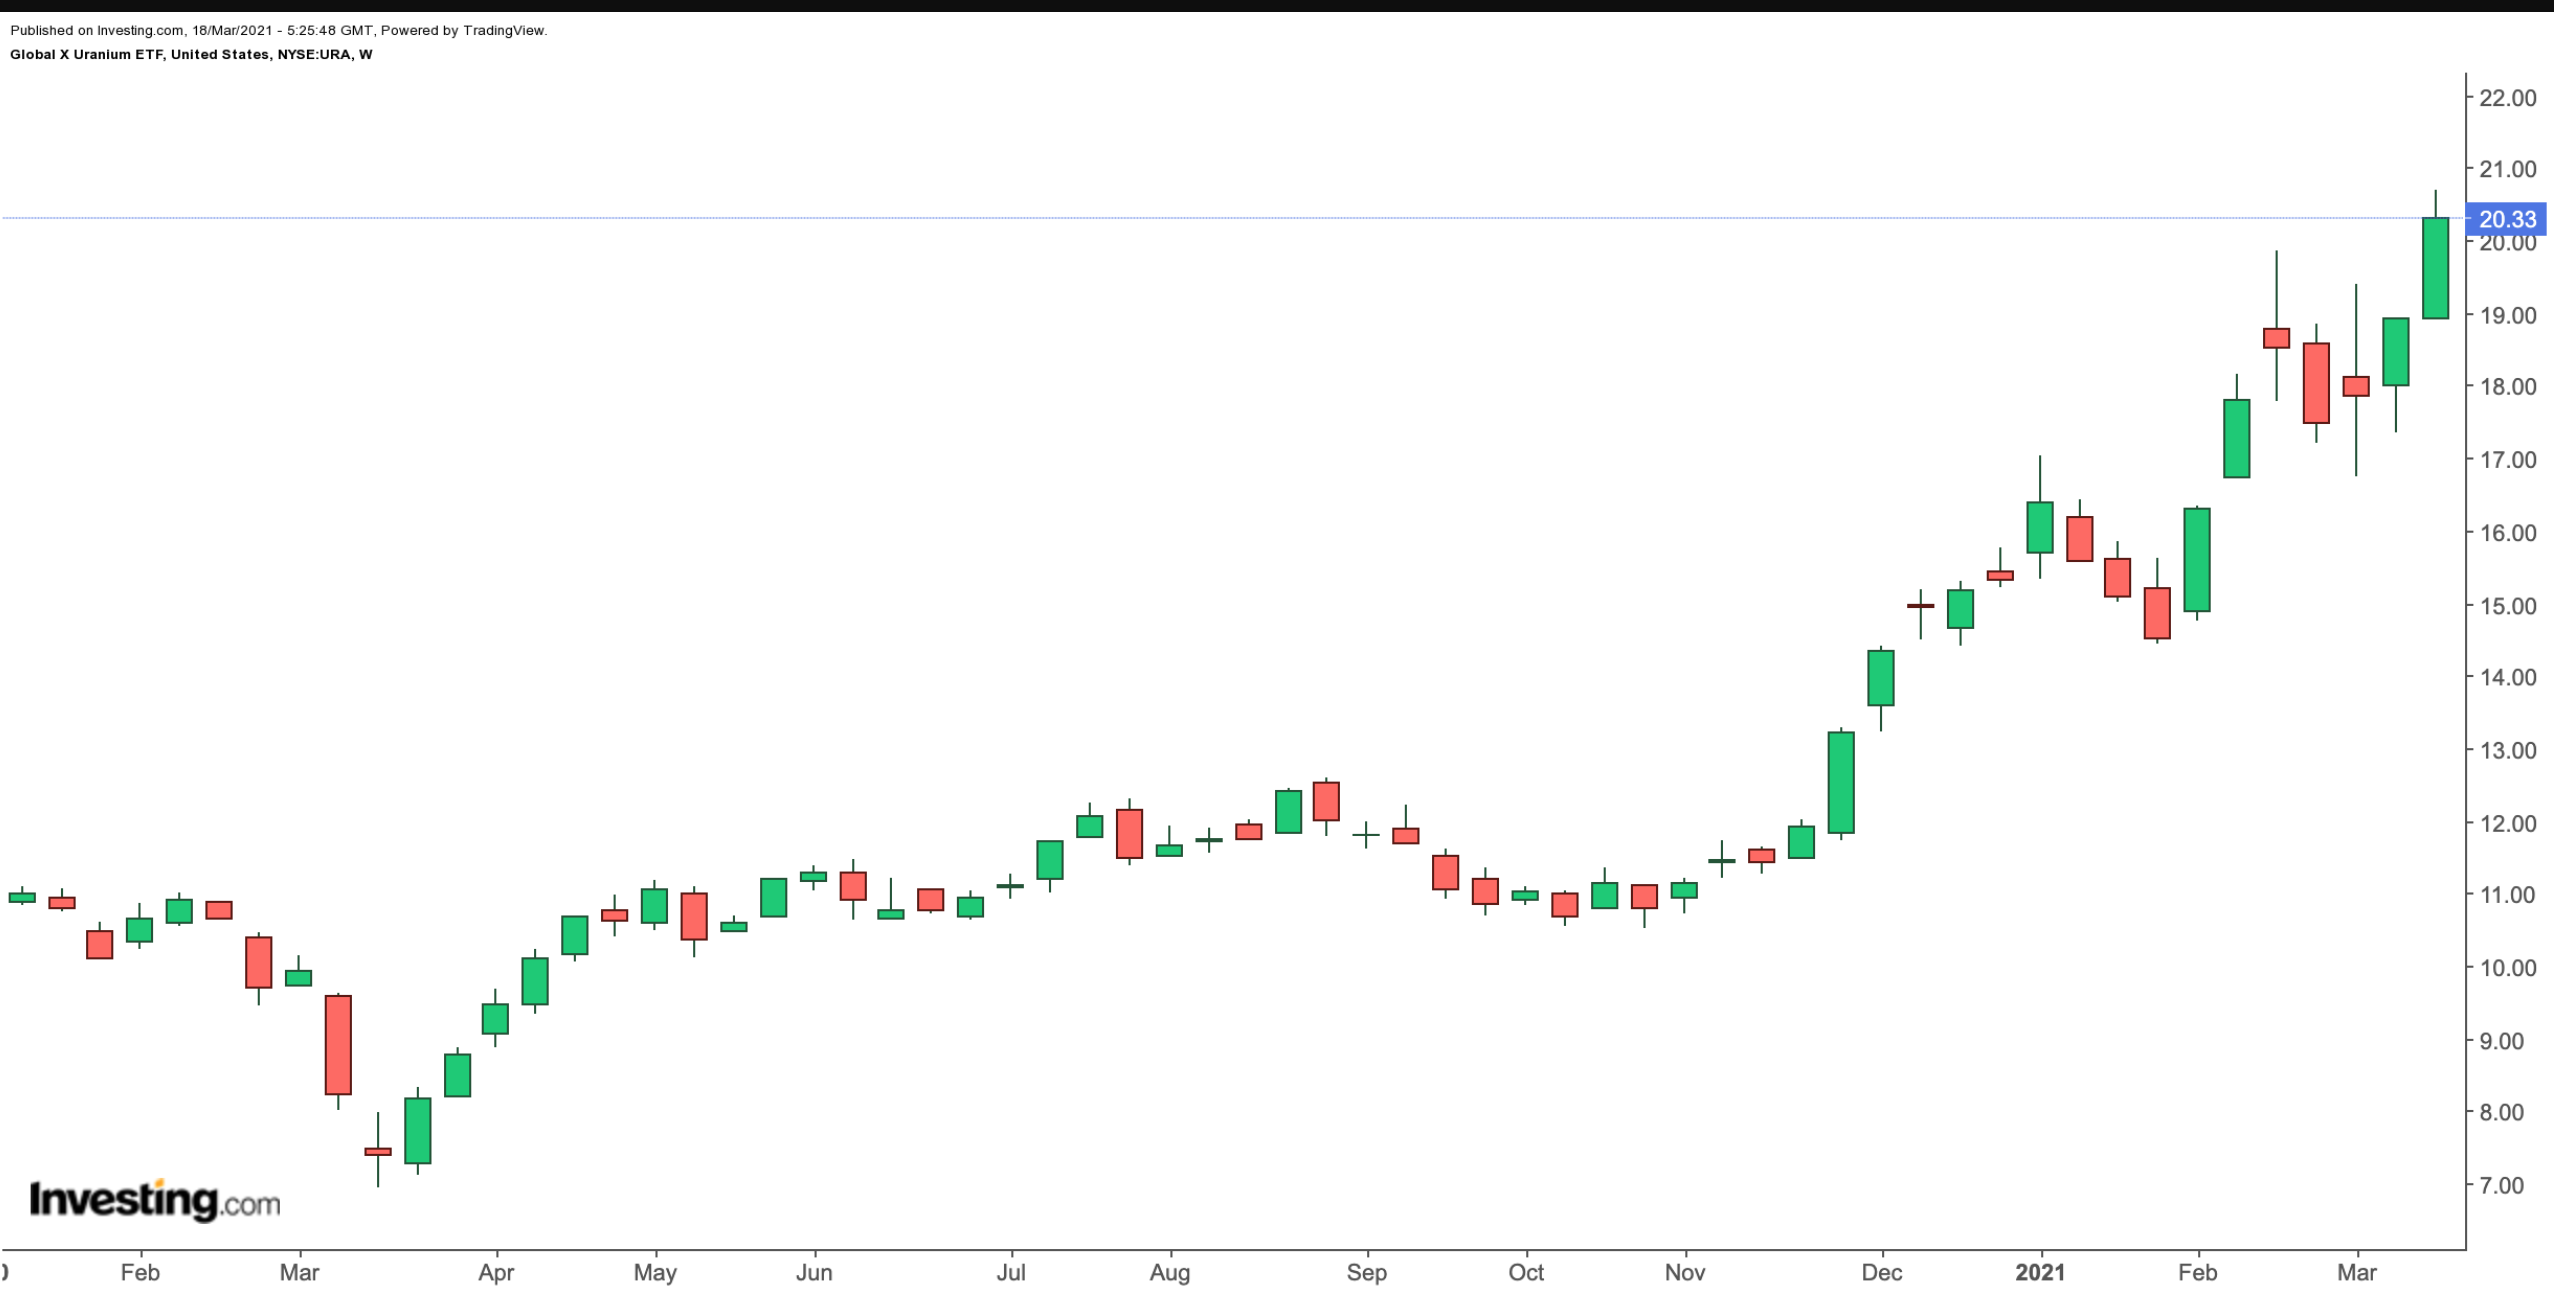
Current Price: $20.33
52-Week Range: $6.95 - $20.71
Dividend Yield: 1.28%
Expense Ratio: 0.69% per year
This fund focuses on uranium, a naturally radioactive heavy metal that is the main fuel for nuclear reactors.
The Global X Uranium ETF (NYSE:URA) invests in global businesses involved in uranium mining as well as the production of nuclear components. The fund started trading in November 2010, and net assets stand at $502 million.

URA, which has 38 holdings, tracks the returns of the Solactive Global Uranium & Nuclear Components Total Return Index. A total of 45% of the companies come from Canada, followed by Kazakhstan (21.3%), South Korea (7.7%), Australia (6.6%) and others. More than 65% of the fund is in the top 10 names, making it top heavy.
Canadian uranium producer Cameco (NYSE:CCJ); uranium miner NAK Kazatomprom (KZ:KZAP); NexGen Energy (NYSE:NXE) (TSX:NXE), which owns prospective uranium exploration assets in Canada; and Colorado-based producer of uranium and vanadium Energy Fuels (NYSE:UUUU) lead the names in the roster.
Over the past year, URA is up close to 173%. It hit a multi-year high in March, reflecting the current rally in the uranium market, which has been strong.
Cameco highlights:
“Uranium does not trade on an open market like other commodities. Buyers and sellers negotiate contracts privately.”
In mid-2007, the uranium spot price was over $130. Now, it is around $28. Those investors who believe a new secular bull-market might be in the cards could consider buying the dips in the ETF.
