Q4 is off to a good start with Asian markets rallying off the slightly improved Chinese PMIs. There has been a growing feeling in the markets that while the global outlook has dimmed somewhat, the current virulence of the selloff was somewhat overdone.
It would be easy to be overly cynical about the Chinese PMIs today; they were still objectively weak and one could still beat up the data or accuse the Chinese government of making it up. Nonetheless, the massive selloff seen in global equities since the start of August was driven by two key factors: concerns about the China slowdown and nervousness about the September Fed meeting.
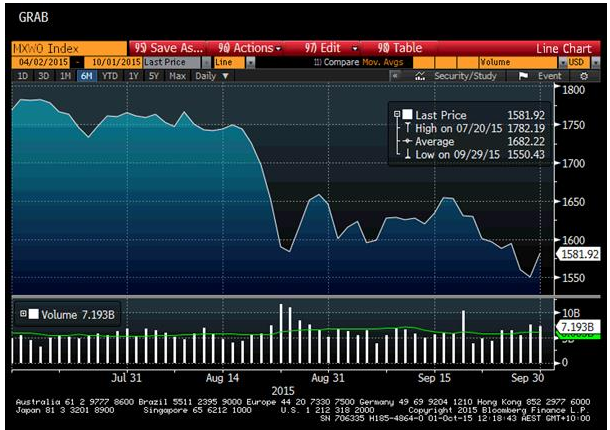
Between 17 August and 29 September the MSCI World Index lost 11.4%. The beginnings of that selloff began after the Peoples’ Bank of China (PBOC) began to devalue the Renminbi on 10 September, with Asian markets and commodities selling off strongly in the wake of that decision.
The precipitating factor in the terminal end of that selloff was the release of the flash Caixin Manufacturing PMI number on 21 August. That PMI prompted the renewed selloff in Mainland Chinese markets, which developed into “Black Monday” on 24 August.

It would be fitting then if the September Chinese PMIs brought the selloff to a close. A nice cyclical outcome consistent with Daoist Theory, slightly different to Dow Theory.
There were good leads from the overnight session as the materials sector was the best performing on the FTSE 100, and gains continued during US trading. This helped push Asian markets up at the open. But markets were given a significant jolt when the Chinese NBS Manufacturing PMI came out above expectations at 11.00am AEST.
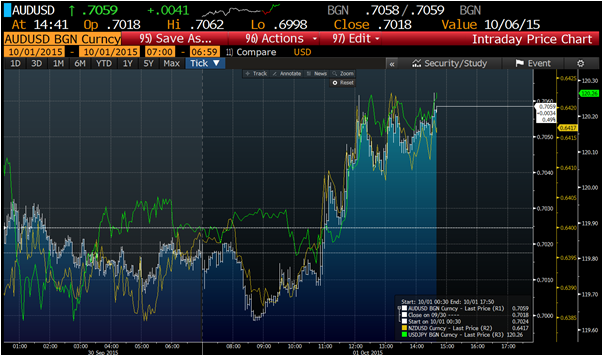
When the final Caixin Manufacturing PMI number came in above expectations as well at 11.45am, markets were primed for an excellent session. The Aussie dollar, the Kiwi dollar and the USD/JPY cross all rallied on the announcement. The ASX pushed up to gain 1.6% and climbing over the 5100 level, while the Nikkei rallied 1.7% right through key resistance at 17,500.

The Chinese NBS Manufacturing PMI came in slightly better than expected at 49.8, slightly up from the previous month’s 49.7. While not seeing a further decline in the number was a positive in itself given the heightened state of negativity around China at moment, there was good news in the subsector breakdown.
The most important subsectors both improved: output rose to 52.3 from 51.7 and new orders rose to 50.2 from 49.7. These numbers do seem to be indicating that the declining activity numbers in China may have hit a floor as the effect of monetary easing and stepped-up fiscal spending start to be felt. Numbers were expected to pick up as we approach the end of the year and the deadline for achieving the 7% growth target rapidly approaches.
Elsewhere, Japan’s Tankan survey of business conditions noticeably pointed down from the previous quarter to 12 from 15, although planned capex numbers improved to 10.9% from the previous quarter’s 9.3%. Coming on the back of the poor Japanese industrial production numbers, speculation that the Bank of Japan (BoJ) will have to step up stimulus in October was given a boost today as former BoJ deputy governor, Kazumasa Iwata, reiterated the need for further easing.
The Nikkei 225 reacted well to the Chinese PMI news, rallying 1.7%, with the financial sector leading the pack rising 3.5%. Materials (+3%) and energy (2.6%) followed closely behind.
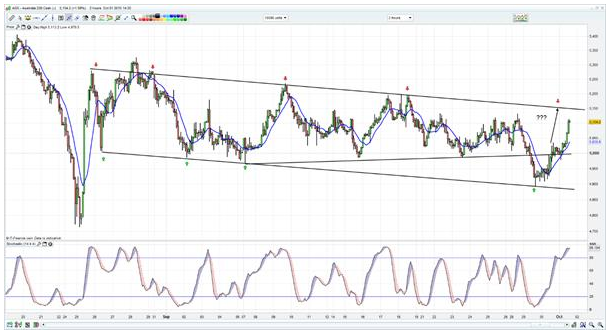
The ASX was off to a good start after managing to close above the key psychological level of 5000 yesterday. It opened up 0.4% on the previous day, picking up significant steam leading into 11.00am when the Chinese NBS PMI was released.
The positive PMI data provided enough support to see the index rally into the 5100 level with a big 1.7% expansion. Although investors should be wary as such a strong performance over two consecutive days does ring some warning signs with strong resistance coming in as the index approaches the 5150 level.

Energy stocks were the best performing sector as they were buoyed by news the world’s biggest consumer of oil may not be slowing as much as feared. The sector was up by 2.3%
Telecommunications were in focus, with recent merger duo Vocus Fpo (ASX:VOC) and M2 Telecommunications Group Ltd (ASX:MTU) both within the top 8 best performers on the ASX, rising 7.8% and 6.3% respectively.
Although OZ Minerals Ltd (ASX:OZL) was the best performer on the index, gaining 19.3% on news the buyout specialist private equity firm KKR had amassed a 10% stake in the resources company. This helped drive a strong gain in the materials sector, which was also boosted by improving Chinese data. The materials sector was up 1.8%, with strong performances from Sandfire Resources NL (ASX:SFR), Syrah Res F (ASX:SYR) and Bluescope Steel Ltd (ASX:BSL).
The banks also had a solid day, gaining 2% as they were similarly buoyed by the improved domestic outlook. Our biggest trading partner looks as if it may have stemmed its steady economic deterioration and this has clearly boosted a range of sectors today.
