Of late, currency analysts in China have become vehemently bearish on the US dollar, citing America's rising debt load, in particular the recent, massive, Biden administration fiscal aid package and chances of higher inflation because of the pandemic and related spending. That's rather ironic since any gains the Chinese yuan may have made against the greenback in 2021 have now been erased as the renminbi weakens.
Of course, this increasingly negative attitude on the global reserve currency by Communist party stalwarts could have much to do with the diplomatic crisis now brewing between the two countries. It started when President Joseph Biden and his administration sanctioned China for the crackdown in Hong Kong.
That was followed last week at the Alaska summit between the two countries by US Secretary of State Anthony Blinken reprimanding China for "violating international norms through their crackdown on Uyghurs and other minorities in Xinjiang, cyber attacks against the U.S. and economic coercion." Yesterday, the US's regulatory agency, the SEC announced it was adopting measures to delist foreign companies from American stock exchanges "if they do not comply with U.S. auditing standards."
Chinese tech giants traded in the US, such as Tencent (OTC:TCEHY) and Alibaba (NYSE:BABA) plummeted during Wednesday's Wall Street session as well as this morning in Asian trading.
Amid rising Treasury yields it appears the yuan is developing a bottom. Technicals are providing some nuanced confirmation.

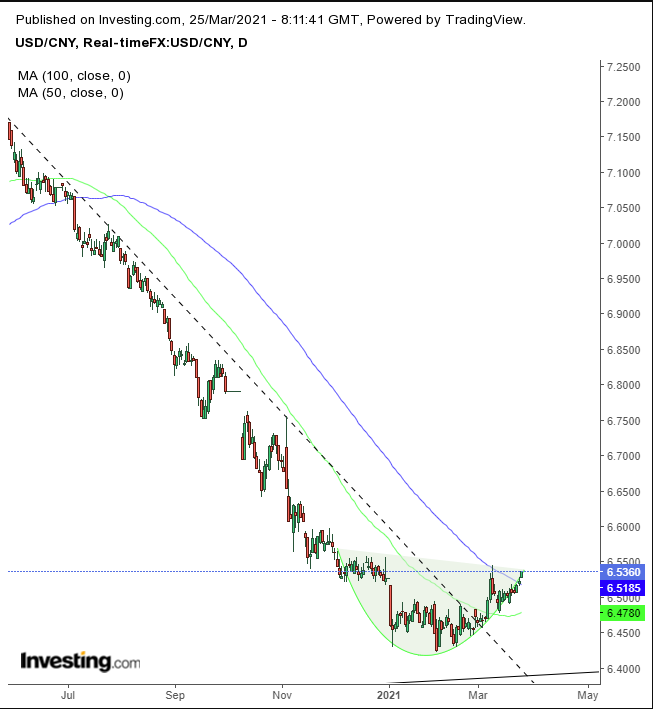
The USD/CNY has been trading within a Rounding Bottom, as prices have been rising in a gradual, rounding formation.
This pattern is a difficult one to call, as it is challenging to determine when it’s complete. We expect a solid green candle above 6.6000 to signal a new uptrend.
The price of the pair already scaled above the 100 DMA after crossing over the 50 DMA for the first time since falling below it in June. This MA has been aligned with the downtrend line since November, with each confirming the meaningful nature of the other.
As we've said previously technical analysis can be like assembling the pieces of a puzzle in order to discover the full picture depicted by a chart. As such, we'll get an even better look at the full picture if we take a step back via the weekly chart.

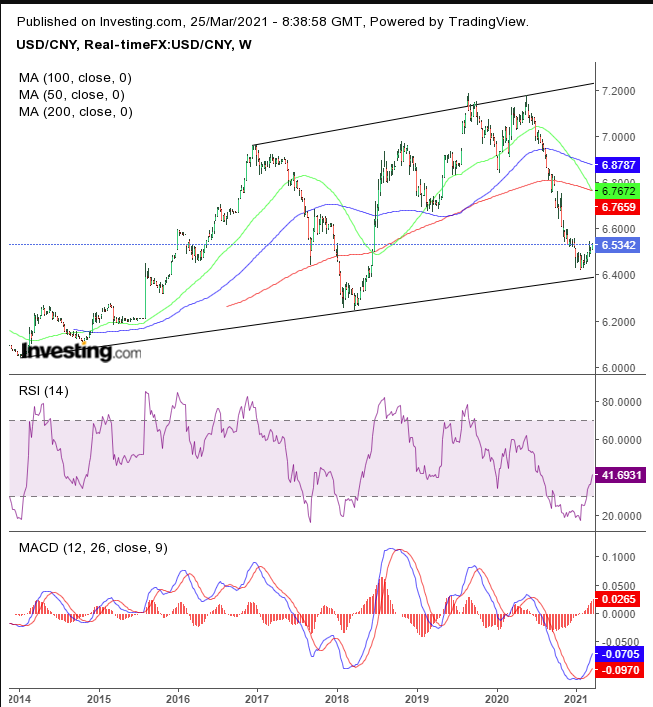
For the first time since the May 2020 high, the pair has rebounded, upon nearing the long-term uptrend line since January 2014. This suggests a return to the top of the rising channel, retesting the pair's all-time high on Sept. 19, 2019, of 7.1870.
The 50 WMA just reached the 200 DMA from above, indicating this as a catalyst, for either a continued downside, or an upward reversal.
Both the weekly RSI and the MACD have bottomed.
Trading Strategies
Conservative traders should wait for a consensus regarding a bottom, with a close above 6.6000, then for a pullback to retest support.
Moderate traders would be content with a close above the previous high in the downtrend, 6.5565, posted on Dec. 31, 2020, then for a buying dip.
Aggressive traders could enter a long position at will, given they understand the higher risk of gaining a head start in the event our scenario follows through for higher reward. Money management is crucial, for survival, moreso than for profit.
Here’s an example:
Trade Sample
- Entry: 6.5000
- Stop-Loss: 6.4800
- Risk: 200 pips
- Target: 6.6600
- Reward: 1,600 pips
- Risk:Reward Ratio: 1:8
