Last week, the PBOC delivered its second cut in three months to its other key lending rate, the 1-year medium-term lending facility (MLF) by 15 basis points to 2.50%. This cut was broadly viewed as a sign China's central bank authority is ready to respond to a slew of weaker than expected data recently which has shown continued deterioration in industrial production, retail sales, employment, and the all-important housing market.
Typically, the MLF has served as a guide for the one-year and five-year loan prime rates (LPRs). It was not so much the case today as the PBOC surprised markets by only cutting the 1-year LPR by 0.10% to 3.45% and holding the 5-year LPR steady at 4.20%. Markets were expecting a 0.15% cut on each rate.
It appears Chinese authorities are favouring a more modest easing approach than markets prefer, as they struggle to reconcile their desire to ease credit conditions for consumers and businesses, whilst discouraging regional government entities amassing more debt, and stoking risk-taking behaviour by the shadow-banking sector. They're also eyeing a weakening Yuan against the US dollar.
The lack of action on the 5-year LPR – a key benchmark rate for many Chinese mortgages – was particularly surprising given rhetoric from Beijing recently that it intends to take steps to boost domestic consumption and sure up demand for residential property. It is the latter, that is demand-side stimulus for Chinese property, which will likely have the biggest impact on China's well publicised failing property developers. This sector was hoping for the bazooka today, but instead barely got the popgun.
Chinese stock market lurches from bad to worse in crisis
Chinese Mainland and Hong Kong stock markets are again under pressure as a result today, with each of the major market indices adding to last week's falls.
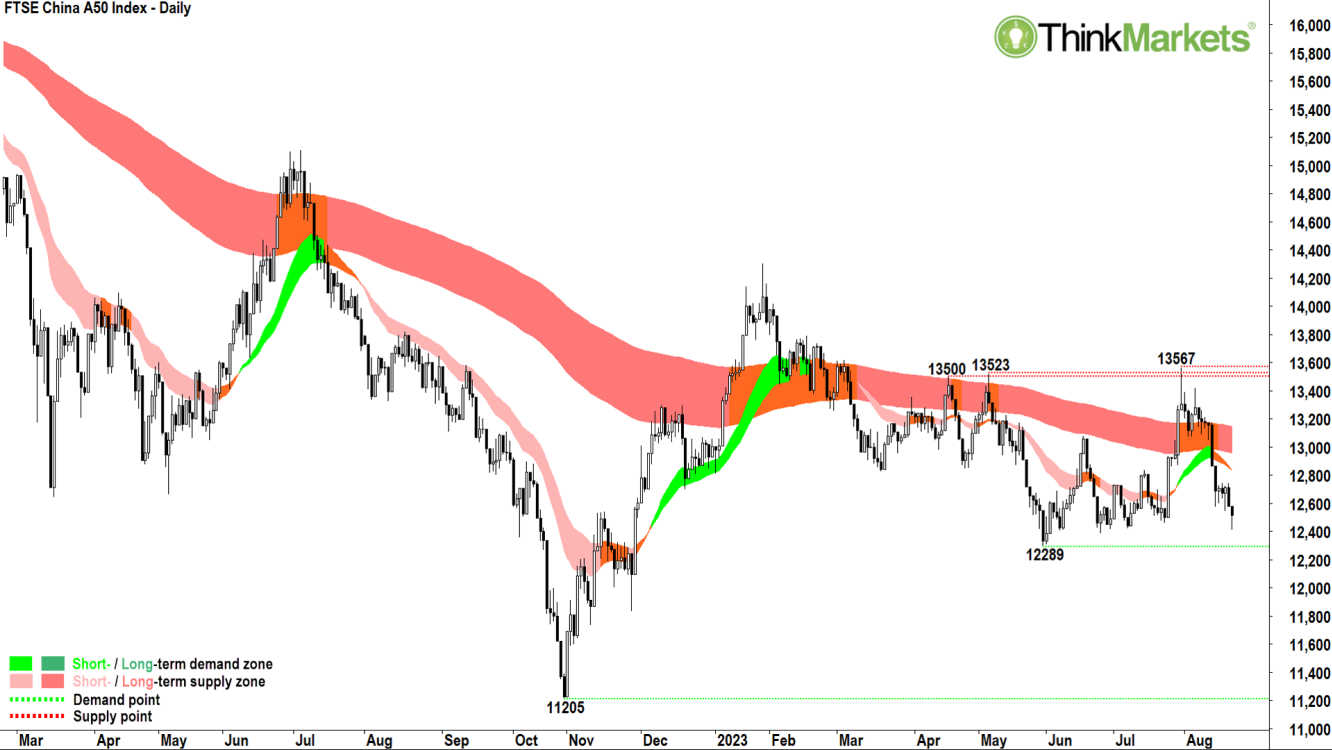
China's FTSE A50 Stock Index includes stocks of companies incorporated in mainland China which can be bought and sold by domestic Chinese and Qualified Foreign Institutional Investors. There are pros and cons of using this index as a barometer for the health of the Chinese stock market – and by extension – the Chinese economy. Pro: representing mainly the performance of stocks Chinese people can trade, it reflects local investor sentiment better than other benchmark indices (E.g., the Shanghai Composite, which contains shares any investor – internal or external – can trade). Con: it is a relatively narrow index, covering 50 large capitalisation stocks mainly in the financial, consumer staples, and consumer discretionary sectors.
From a technical standpoint, the FTSE A50 is in a well established short-and-long-term downtrend. Major peaks in late-July, January, and July 2022 appear to be getting progressively lower, and the candles over the last two weeks are decidedly supply-side in nature (i.e., black bodies and/or upward pointing shadows). If the FTSE A50 should close below the point of demand set at 12289 on 31 May, the next logical target is the October 2022 low of 11205.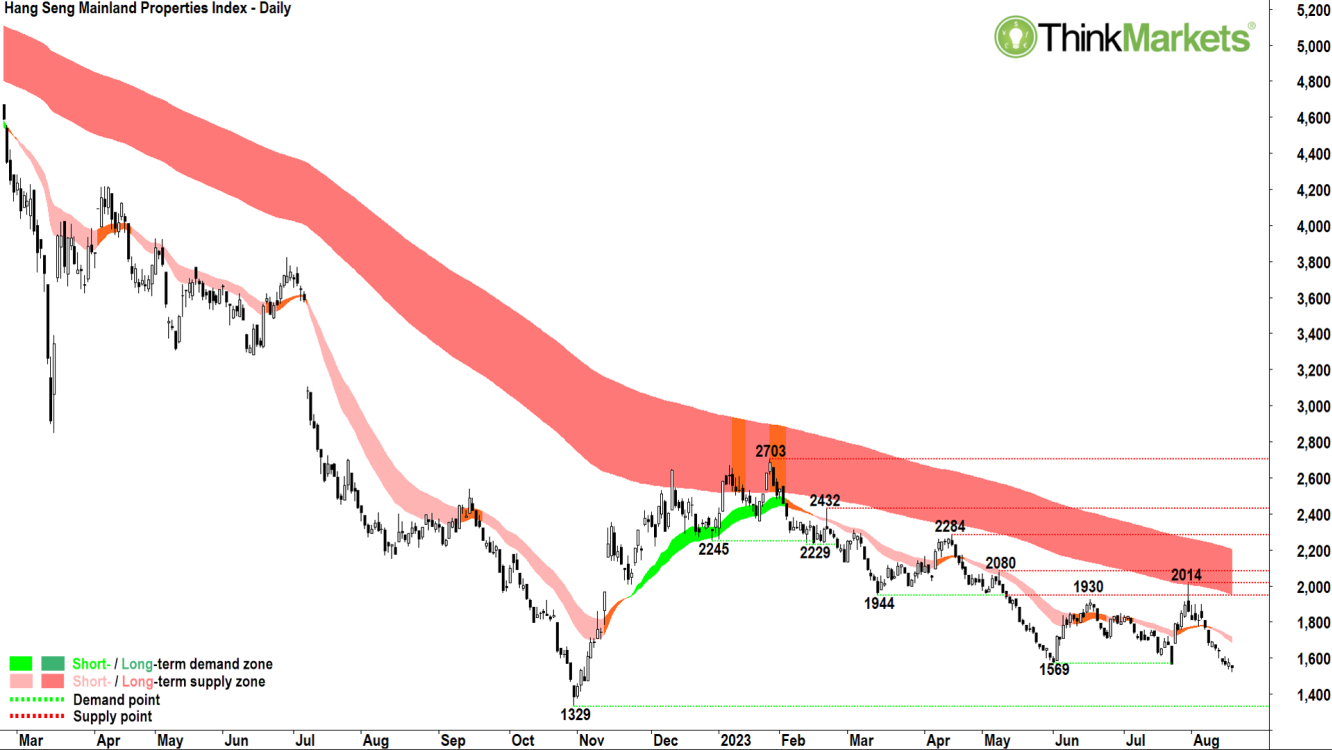
The Chinese property sector accounts for approximately 30% of Chinese GDP. It makes sense then that if the property sector sneezes, the Chinese economy catches a cold. Some would argue it's doing quite a bit worse than sneezing at the moment! So, it is possible the chart above of the Hang Seng Mainland Properties Index (HSMPI) could be a leading indicator for the FTSE A50, and also for the broader Chinese economy.
The HSPMI contains stocks of 10 of China's biggest property developers including Wharf Holdings, China Overseas, China Res Land, and Country Garden. Country Garden in particular, has been all over the news lately because it missed repayments on several of its debt obligations two weeks ago.
From a technical standpoint, the HSMPI looks decidedly worse than the FTSE A50 as it short-and-long-term trends are far better established, and each trend appears to be taking on a steeper downward angle of attack. The October 2022 low of 1329 which occurred prior to the rally which started on rumours of, and then confirmed by the COVID re-opening, is the next logical downside target.
Australian shares down but not out, yet!
Locally, there's been surprisingly little negative fallout from the PBOC's rates disappointment. The benchmark S&P ASX200 barley moved immediately after the announcement and has only modestly drifted lower with other major Asian indices through the afternoon.
If anything, one of the sectors you'd expect to do the worst the past couple of sessions – the Materials Sector – has actually rallied modestly on the back of a bounce in the iron ore price. It's up 0.85% from Thursday's close but remains 6.5% lower than when news of Country Garden's most recent debt troubles broke. Iron ore prices moved higher on steel sector specific news, as steel production curbs in some regions of China were not as harsh as anticipated.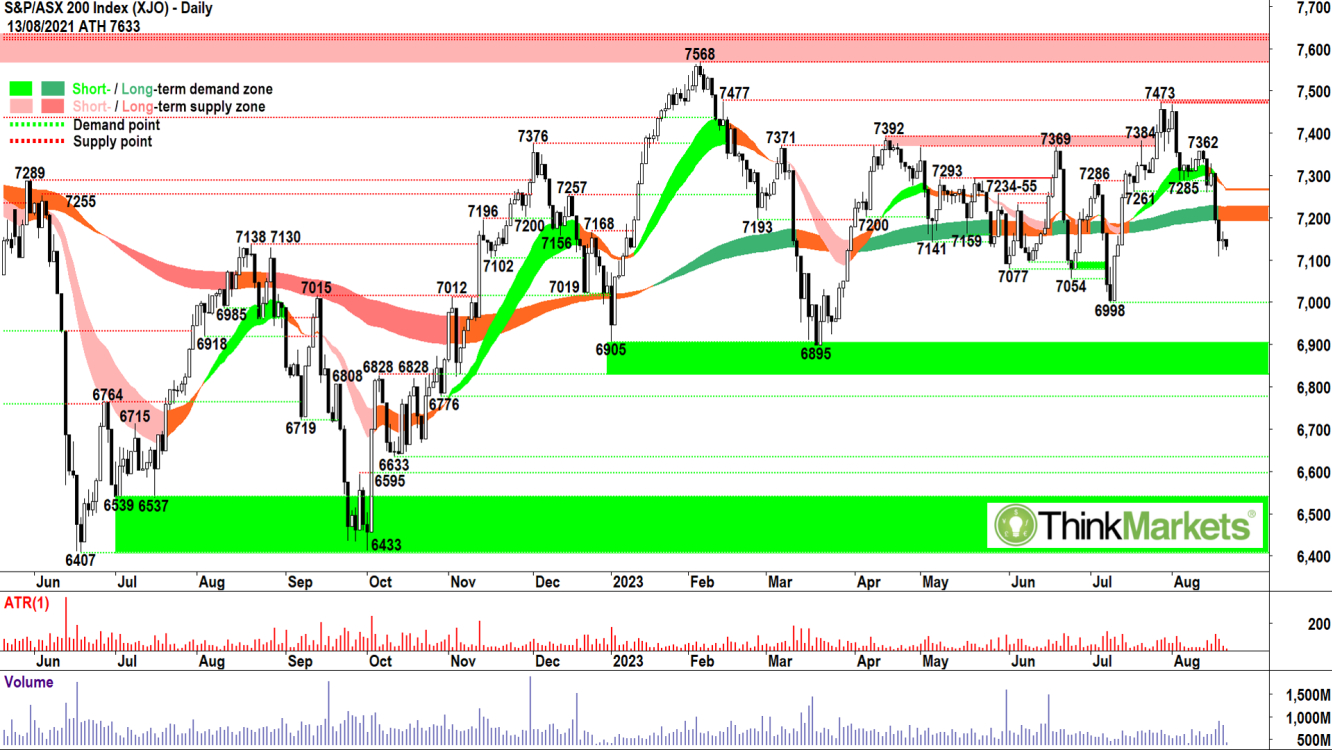
From a technical standpoint, the ASX200 is for the most part stuck in a wide trading range between the March low of 6895 and the all-time high set in August 2021 at 7633. The short-and-long-term trends have once again swung lower, and the price action has swung back to lower peaks and lower troughs. Candles are predominantly supply-side over the last couple of weeks.
There's little to get excited about here and there's a clear tendency to mean-revert to the long-term trend ribbon. This means both downside and upside potential are limited. There's little to do here from an index standpoint, so as they say in the classics: "It is clearly a stock pickers market!'.
Stocks worth watching on the Australian Stock Market this week
Stock 1 – Ampol (ASX: ALD)
Ampol Limited operates a fuels and infrastructure, and convenience retail business. Its primary activities include the purchase, refining, distribution and marketing of petroleum products and the operation of convenience stores.
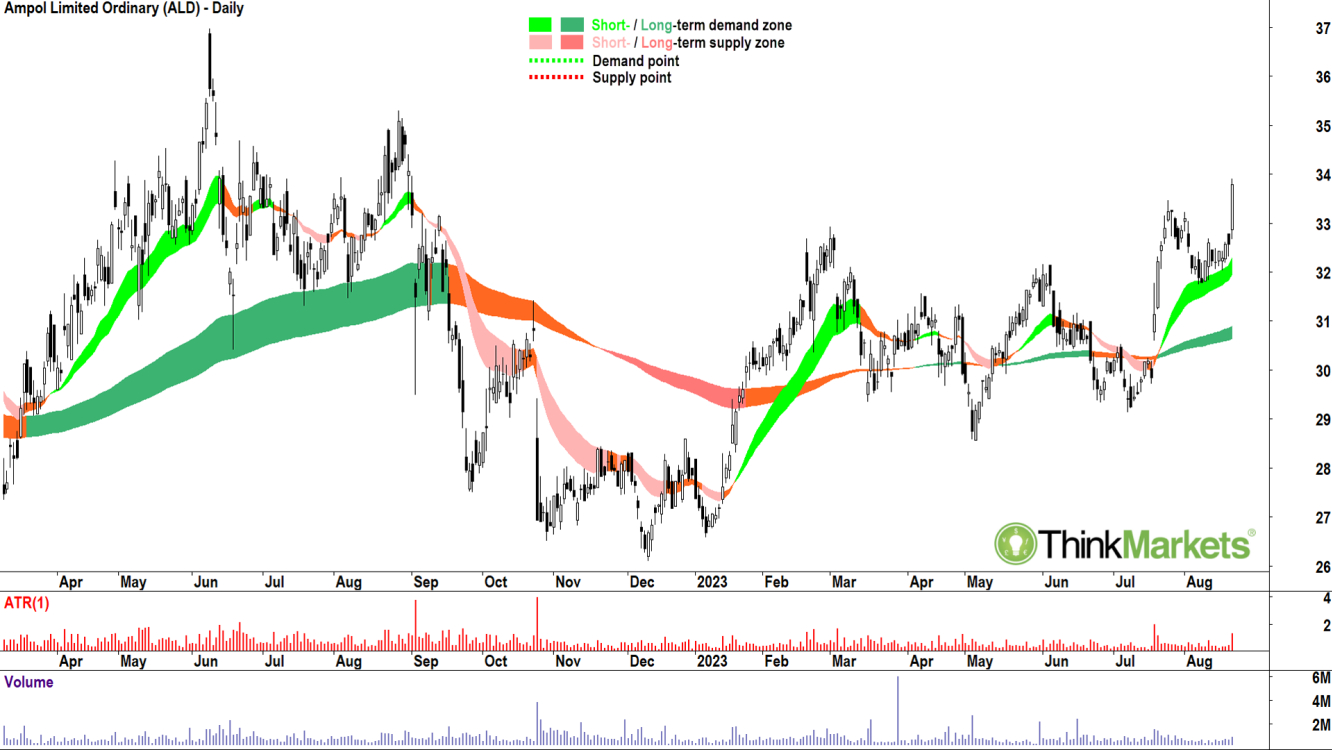
The ALD chart shows the price is in a well-established short-term uptrend (light green ribbon) and a recently re-established long-term uptrend (dark green ribbon). The price action is higher peaks and higher troughs. The candles are predominantly demand-side in nature (i.e., white bodies and/or downward pointing shadows). In combination, these technical factors demonstrate substantial excess demand for ALD shares.
The points of supply of 25 Jul at 33.47 and 10 Aug at 32.69 should now act as areas of excess demand (support). Excess supply (resistance) is expected at the 26 August 2022 high at 35.30 (minor) and then the 8 June 2022 high at 36.98 (major). Stops are best set below points of demand. I suggest watching closely for supply-side candles at potential points of supply to guide exits. Until then, targets are open ended.
Analysts view: I am comfortable adding risk to ALD around the current price and remaining in a long position while the price continues to trade above the short-term trend ribbon.
Stock 2 – ARB Corporation (ASX: ARB)
ARB Corporation designs, manufactures, distributes and sales motor vehicle accessories and light metal engineering works. Its product range includes bull bars, side rails and steps, towing, canopies, lids and tub accessories, roof racks, suspension systems, lights, air compressors, drawers and cargo solutions, portable fridge-freezers and other camping accessories, and battery and solar systems, among others.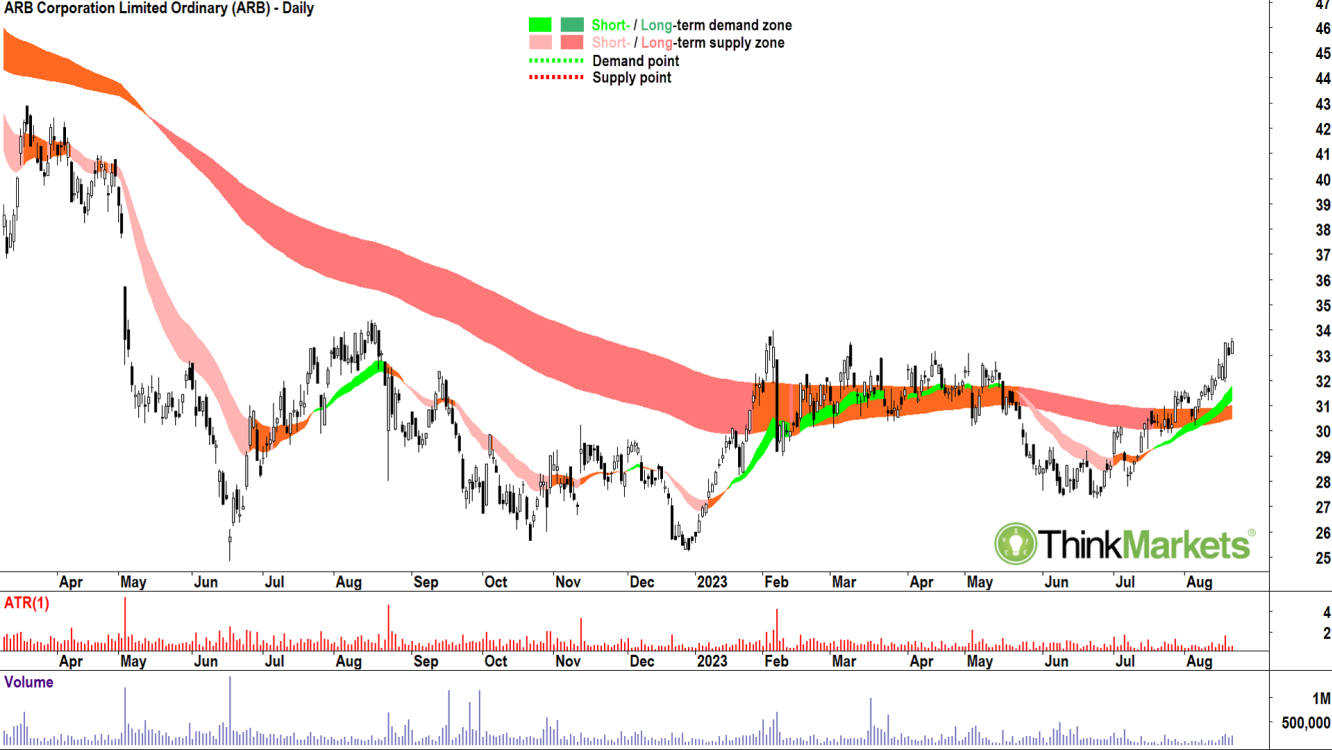
Where the ALD chart is a continuation setup, the ARB chart is a turnaround setup. Turnaround setups are those where the long-term trend is not yet explicitly up, but it is demonstrating signs of transitioning to a long-term uptrend. The short-term trend, however, is clearly up, and the price action and candles suggest excess demand has returned to the system.
The ARB chart shows the price is in a new short-term uptrend and the price action has returned to higher peaks and higher troughs. The candles are predominantly demand-side in nature. The long-term trend is down (amber ribbon) but has flattened and compressed, demonstrating downside momentum has abated.
Excess demand is likely to reassert around the 17 August trough low at 31.91. The price is interacting with potential excess supply at the 6 February high at 34.02. Beyond this, there is little resistance expected until two key previous points of demand from 9 March 2022 at 36.35 and then 13 April 2022 at 38.22. Stops are best set below points of demand. I suggest watching closely for supply-side candles at points of supply to guide exits. Until then, targets are open ended.
Analysts view: I am comfortable adding risk to ARB around the current price and remaining in a long position while the price continues to trade above the short-term trend ribbon.
Stock 3 – Bannerman Energy (ASX: BMN)
Bannerman Energy is focused exploration and development of its uranium assets in Namibia. Its Etango Uranium Project is in the Erongo Region of Namibia and contains resources of 207 million pounds of contained U3O8. Bannerman has completed definitive feasibility study (DFS) and environmental permitting on the Etango Project and aims to develop an open pit mining operation once suitable project economics can be attained.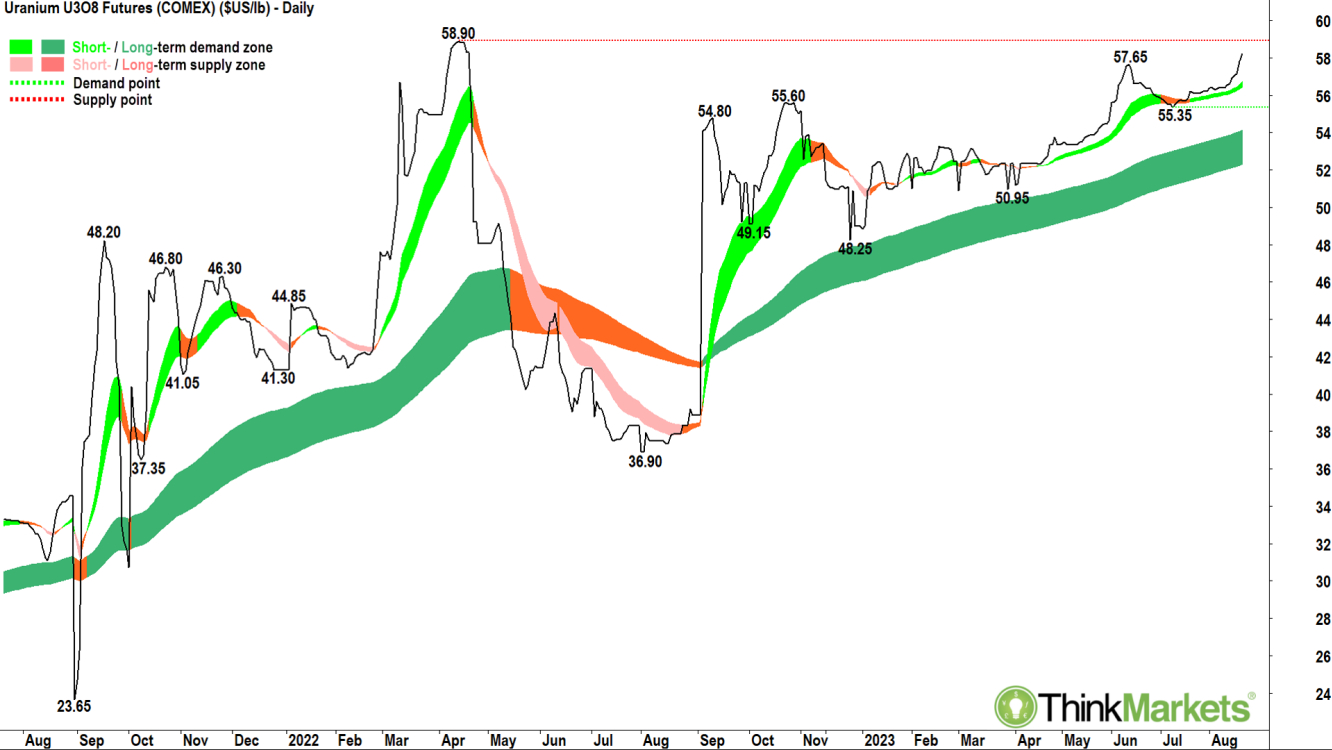
Uranium prices are pressing towards 18-month highs around US$60/lb and beyond that to 12-year highs at US$67/lb. Short-and-long-term trends and price action look strong.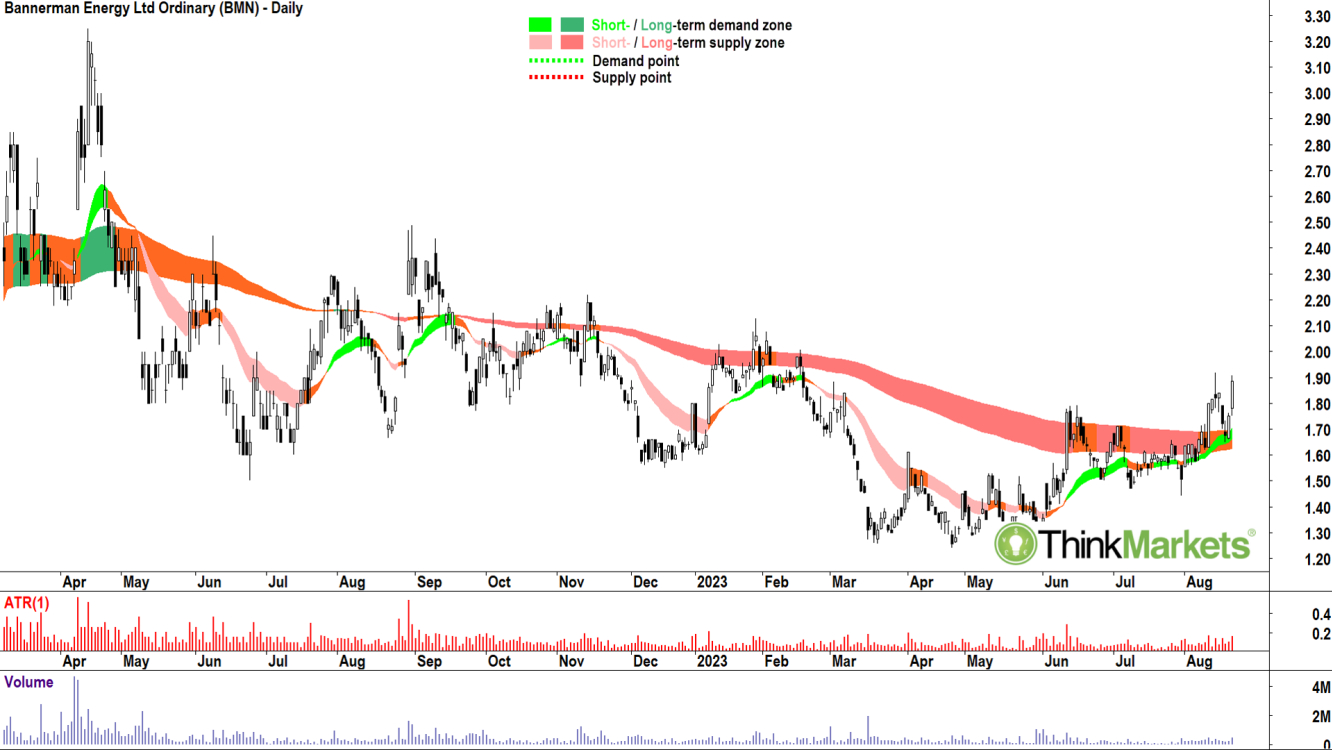
The BMN chart is another turnaround setup. It shows the price is in a new short-term uptrend, and the price action has returned to higher peaks and higher troughs. The candles are predominantly demand-side in nature. The long-term trend is down (amber ribbon) but has flattened and compressed, demonstrating downside momentum has abated. The price action has tested and held above the long-term trend ribbon demonstrating it is now offering dynamic support.
Excess demand is likely to reassert around the 17 August trough low at 1.65. There are several potential previous points of supply which could offer upside resistance, including 14 November 2022 at 2.22 and 31 August 2022 at 2.49. Stops are best set below points of demand. I suggest watching closely for supply-side candles at points of supply to guide exits. Until then, targets are open ended.
Analysts view: I am comfortable adding risk to ALD around the current price and remaining in a long position while the price continues to trade above the short-term trend ribbon.
