A shortened session on Wall Street on Friday night saw risk markets remain somewhat muted without much direction although USD moved broadly lower in currency land. The Australian dollar was pushed up to a new three month high well above the 65 cent level while Euro managed to return above the 1.09 handle.
US bond markets saw a slight rise in 10 year Treasury yields which are now threatening the 4.5% level. Oil prices however saw a minor pullback as Brent crude lost more than 1% and pushed below the $80USD per barrel level while gold held on above the $2000USD per ounce level, in a strong sign that support is clearly building for the shiny metal.
Looking at share markets in Asia from Friday’s session where mainland Chinese share markets struggled throughout the day with the Shanghai Composite eventually closing some 0.7% lower at 3040 points while in Hong Kong the Hang Seng Index slumped nearly 2% to finish the week at 17559 points.
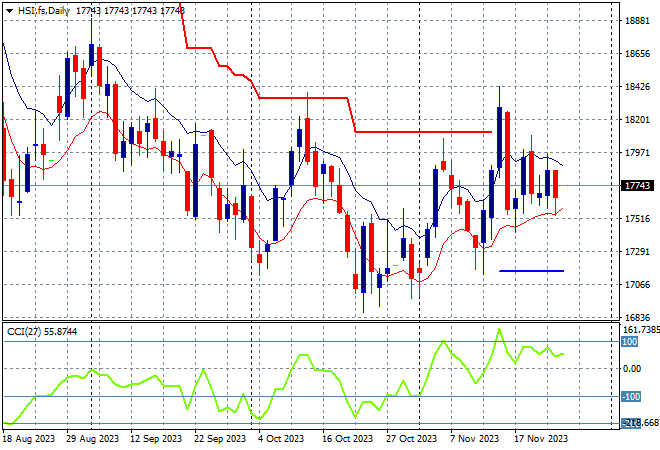
The daily chart was showing a significant downtrend that had gone below the May/June lows with the 19000 point support level a distant memory as medium term price action remains stuck in the 17000 point range. Daily momentum readings are retracing back to positive settings despite Friday’s reversal with the potential for a fill in rally here towards the ATR resistance at the 18000 point level:
Japanese stock markets were however able to maintain their bounceback with the Nikkei 225 putting on 0.5% to 33625 points for a new monthly high.
Trailing ATR daily support is a long way below the current bounce that has now exceeded the September highs at the 33000 point level with daily momentum still in the overbought zone but not over-extended. I’m watching correlations with Wall Street and Yen to see if there is more upside here:
Australian stocks were barely able to gain positive momentum with the ASX200 closing just 0.1% higher at 7040 points.
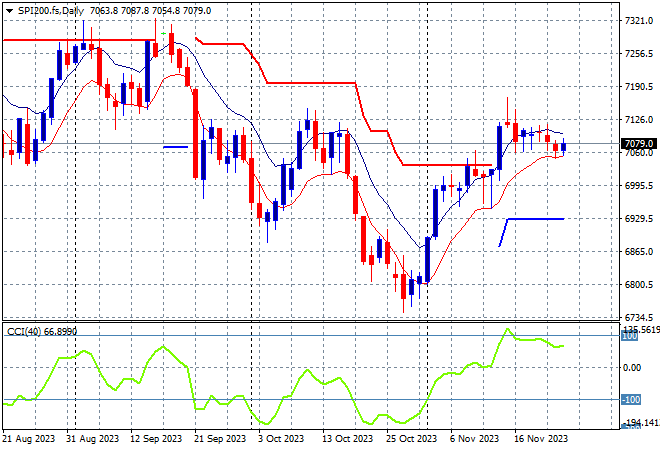
SPI futures are slightly higher again in line with mild lifts in Wall Street futures so we should see the 7000 point level continue to firm as daily support. The daily chart is trying to look more optimistic here in the medium term with short term price action filling a hole against the tide, but sideways at best so far:
European markets were broadly positive across the continent, if a little hesitant due to the lack of direction from Wall Street with the Eurostoxx 50 Index lifting more than 0.2% to finish at 4372 points.
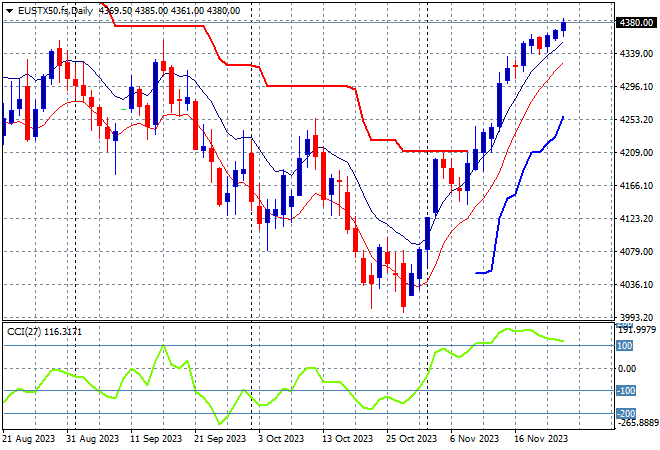
The daily chart shows weekly resistance at the 4300 point resistance level taken out with this large bounce setting up for further gains if that level is pushed aside proper. Support at the 4250 level should be quite firm on any pullback but I’m watching the much higher Euro possibly providing a headwind:
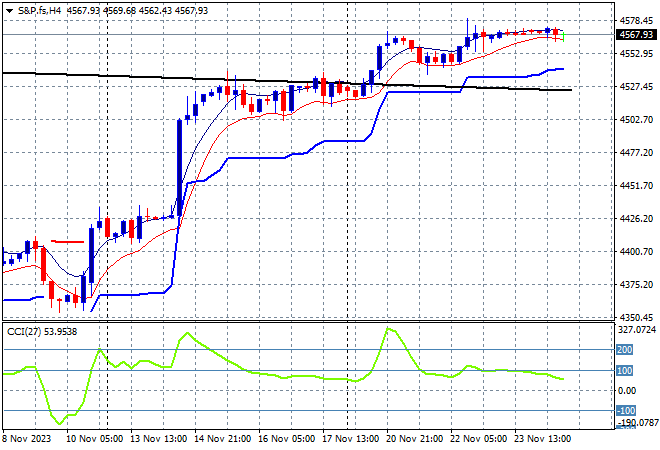
Wall Street reopened following Thanksgiving with unexciting returns as the NASDAQ slipped about 0.1% while the S&P500 lifted just 2 points or less than 0.1% to close the week out at 4559 points.
Short term momentum was overextended as price action bounced strongly off the recent low at the 4100 point level for the potential for a retracement back to trailing ATR support on the four hourly chart building here. Watch the 4500 point level to hold though:
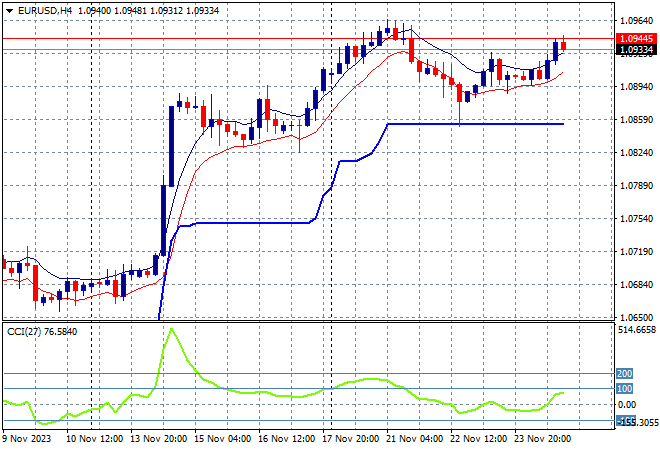
Currency markets saw a return of a weaker USD after the return of over-stuffed US traders to their desks with USD down over 0.5% against most of the undollars with Euro inching back above the 1.09 handle.
The recent consolidation was after the union currency was able to fend off more Fedspeak in recent weeks and remain in a bullish, albeit neutral condition. Support at the recent weekly lows around the 1.06 level was not tested with new short term support upgraded to the 1.07 mid level at a minimum, but there could be a sharp short term reversal here to ATR support:
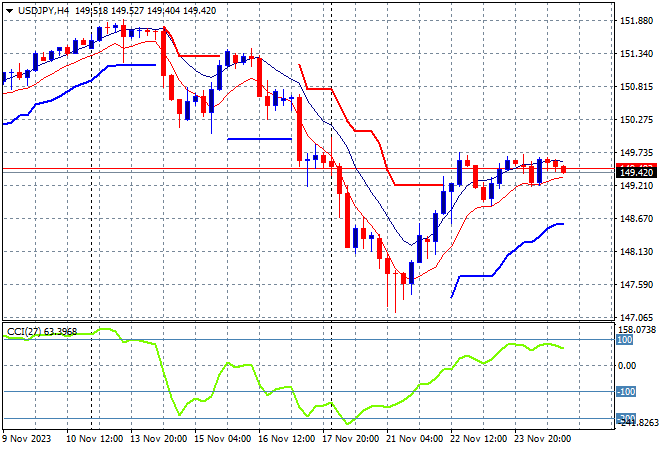
The USDJPY pair was unable to follow through on its bounce back, consolidating at the mid 149 level without making a new daily high after pushing well above the November lows from the mid week bounce.
Four hourly momentum has punched its way out of nearly extreme oversold settings to become positive, but not yet overbought with price action suggesting a swing play here that could push beyond the 149 level but I suspect we need another catalyst to get things moving:
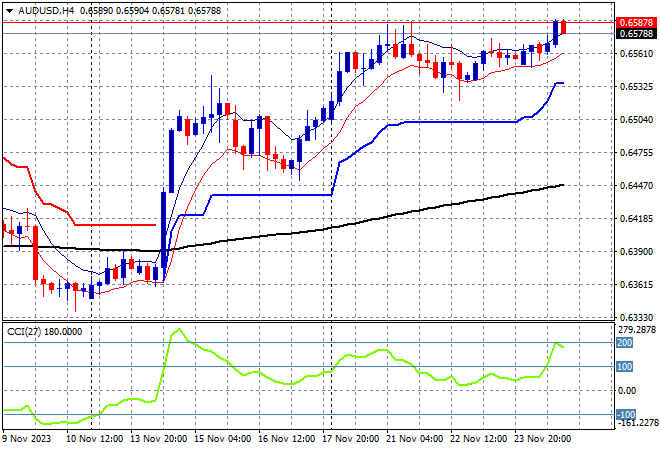
The Australian dollar was not just resilient but pushed even further high on Friday night with USD still not really pushing it around like other pairs with price action breaking out above the mid 65 cent level for a new three month high.
The Pacific Peso remains under medium and long term pressure but was able to test the mid 63 level following the RBA’s recent rate hike with momentum now overbought and looking very positive as we start a new trading week, but watch for a potential pullback to the 65 handle proper:
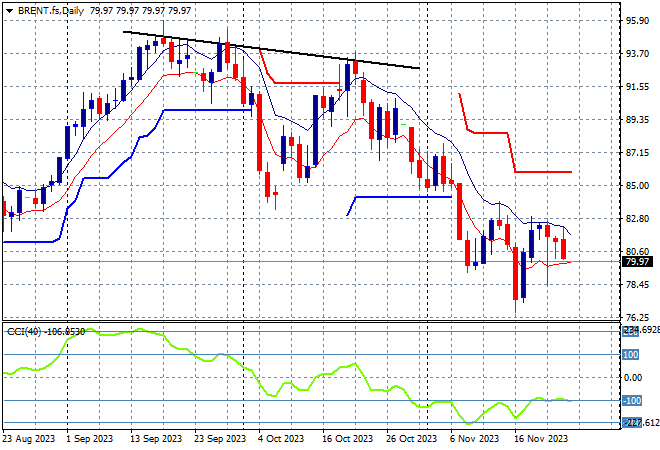
Oil markets remain in flux with the growing conflict in the Middle East and potential OPEC cuts adding to volatility with another down session on Friday night that saw Brent crude finishing more than 1% lower and finally breaking below the $80USD per barrel level.
After almost reaching $100 in mid September, price was looking to return to the August levels around the $85 area where a point of control had been established before the recent breakout. Daily momentum is still in oversold settings with this failed test of support at the August level setting up for further falls below:
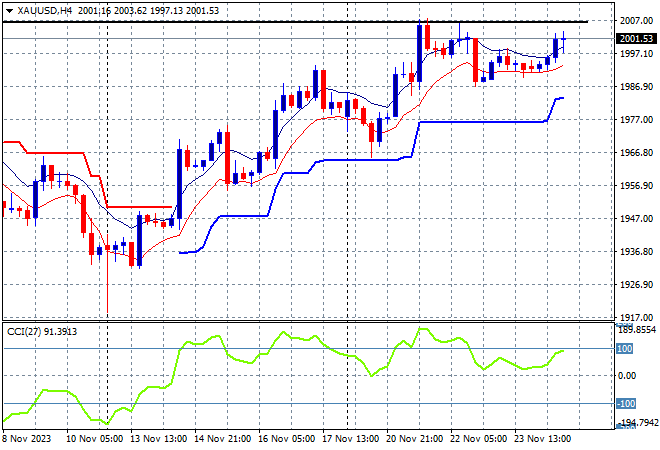
Gold is still holding on to its recent advances as it remains on trend despite the decoupled USD correlation against other undollars, with its recent fallback below the $2000USD per ounce level finding some later dip buyers to push just above that level on Friday night.
Daily support is building again here as the four hourly chart shows short term resistance (upper horizontal black line) the area to truly beat again: