* Yuan suffered worst month on record in June
* China c.bank steps in to stem fall but investors sceptical
* Asian currencies set to be hit hardest by yuan slide
* Commodity-linked pairs, EM will also feel the pain
By Tommy Wilkes and Karin Strohecker
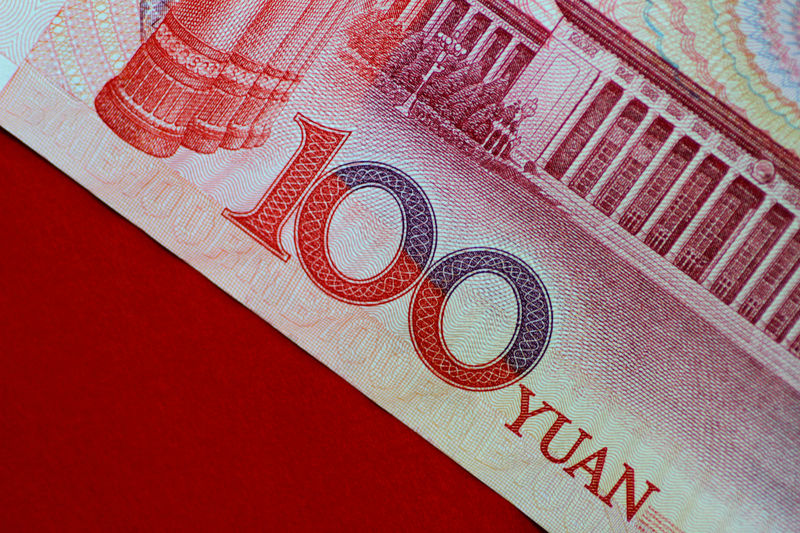
LONDON, July 11 (Reuters) - China's yuan suffered its biggest ever monthly drop in June, battered by worries that a deepening trade conflict with the United States will squeeze its economy and investors will pull out their money.
The Chinese central bank has moved to calm markets, pledging to keep the yuan at a stable and reasonable level. Yet many traders expect any bounce in the currency to be short-lived. controlled decline in the yuan would help Beijing counter the impact of U.S. tariffs already slapped on $35 billion worth of goods, as well as the spectre of levies on hundreds of billions of dollars more.
But with China's share of global exports close to 20 percent, a much bigger fall will have far-reaching consequences beyond its neighbouring Asian shores, from Latin America to the heart of the euro zone's biggest economy: Germany.
Below are five charts explaining where to find the likely hot spots.
HIT TO EVERYONE, INCLUDING EUROPE
China's massive role in global trade means most countries will be impacted by a slowdown in its economy and curbs on trade under President Donald Trump's tariffs. a trade-weighted basis the yuan .RXYH .RXYY fell 4 percent in 12 days from mid-June, a huge move for the still tightly-controlled currency that returns it to levels touched in late 2017. Against the dollar CNH=D3 , the yuan touched a one-year lows in offshore markets.
"The closer you are geographically to China the bigger the impact," said Kit Juckes, a strategist at Societe Generale (PA:SOGN). "But the impact is big for everybody."
Europe is at risk, particularly export-reliant giant Germany. Automaker shares have fallen because of the spectre of U.S. tariffs, and Germany's DAX .GDAXI is underperforming the pan-European index .STOXX .
Europe is arguably more vulnerable than the United States. China has a more than 15 percent share of European Union trade, roughly the same as of U.S. trade.
After weakening earlier in the year, the euro has rallied 4.5 percent against the yuan EURCNH= since the start of June - broadly matching its gains against the dollar's, and more bad news for companies that sell to China.
Several European economies are among the most exposed to global value chains.
For an interactive version click: https://tmsnrt.rs/2tSOb4w
Analysts say consequences for currencies will depend in part on the causality of yuan depreciation.
If the renminbi weakens gradually because Beijing wants to offset losses from reduced U.S. trade, the impact on other currencies could be limited. But if the yuan tumbles 10-20 percent due to an economic slowdown or capital flight then weaker commodity prices, shrinking global trade and a massive hit to anyone reliant on Chinese demand is virtually guaranteed.
ASIAN NEIGHBOURS
Asian countries heavily exposed to Chinese appetite for their exports are already feeling the pain. These economies now face rising U.S. dollar funding costs and the prospect of a tariff-induced Chinese slowdown.
Since early June the Taiwanese dollar TWD= has lost 2.5 percent against its U.S. counterpart, the Korean won KRW= 4.8 percent, the Thai bhat THB= 4 percent and the Indonesian rupiah IDR= 3.4 percent.
TD Securities says Japan, South Korea and Taiwan are particularly exposed to worsening trade relations because they top the list for China's "Trade in Value Added", though the yen will likely avoid selloffs due to its safe-haven status.
"Asian low yielding currencies, especially the likes of KRW, TWD, THB and SGD (Singapore dollar) will not escape. Those with current account deficits, namely PHP (Philippine peso), IDR and INR (Indian rupee) may also continue to see pain, adding to their depreciation paths registered so far this year," TD Securities said.
COMMODITY EXPORTERS
China is the world's largest consumer of key commodities such as copper, coal and aluminium and any sign that a weakening economy is sapping demand will whack commodity-linked currencies.
Australia, whose mining industry depends highly on Chinese demand, "seems to act as the market proxy for China risk," said Simon Derrick, head of the BNY Mellon markets strategy team.
The Australian dollar AUD= fell 3.4 percent versus the U.S. dollar from the start of June to early July when it touched its lowest since January 2017. The New Zealand dollar NZD= has also fallen, by 4 percent in 2018.
And the Brazilian real's BRL= sensitivity to its big iron ore, sugar and soybean industries has sent it lower: by 2.5 percent since early June, and 18 percent in 2018. It is trading near its weakest since March 2016.
EMERGING MARKET IMPACT
The yuan slide comes at a tricky time for emerging market currencies, some of which closely track the renminbi.
Emerging markets have struggled this year as the dollar rallied and worries about their economic health rose.
In a recent research paper examining links between the renminbi, Chinese central bank policy and emerging market currencies, the Bank for International Settlements found such currencies can track the yuan, but do not do so consistently.
"The period of most predictable and multilateral management of the renminbi corresponded to the highest co-movement," researchers found, explaining that this could be because policymakers elsewhere incorporate offshore renminbi movements when pricing their own currencies.
A falling yuan will mean more support for a dollar that has rallied since mid-April on the back of economic strength and tightening monetary policy.
Societe Generale's Juckes warns of the danger of "an exaggerated move higher" for the dollar.
A stronger greenback would raise funding costs and heap more pressure on emerging economies, and put a potentially dangerous squeeze on the most indebted.
<^^^^^^^^^^^^^^^^^^^^^^^^^^^^^^^^^^^^^^^^^^^^^^^^^^^^^^^^^^^ Asia Real Effective Exchange Rates
https://reut.rs/2IWCJcB Most globalized economies at risk in trade war
https://tmsnrt.rs/2tSOb4w Co-movement with daily renminbi movements against the dollar
https://reut.rs/2IZjM9a Commodity-linked currencies
https://reut.rs/2NBM4dG Yuan's inflation-adjusted trade-weighted basket
https://reut.rs/2J4f9uN
^^^^^^^^^^^^^^^^^^^^^^^^^^^^^^^^^^^^^^^^^^^^^^^^^^^^^^^^^^^>
