👀 Ones to watch: The MOST undervalued shares to buy right nowSee Undervalued Shares

Copper Begins To Stir Offering Clues To Overall Commodities

Published 15/09/2016, 02:14 pm
HG
-
US10YT=X
-

Yes, Copper has been a disastrous commodity, largely because it is closely linked to the health of the Chinese economy.

Let's notice on the enclosed daily chart that Copper has been in a period of relative stability between 2.00 and 2.25 for the past 10 months, which represents either a sideways, bearish continuation pattern within the confines of the dominant intermediate-term bear trend—ahead of another downleg, or a multi-month base formation that will challenge key resistance at 2.27-2.32 and break out to the upside into a powerful recovery rally.

It is interesting that 10-Year Yield has climbed above its 2016 resistance line at 1.62%, perhaps reflecting growing perceptions that the U.S. economy and the Chinese economy are in better condition than most people realize, which also is reflected in the lift in Copper prices.
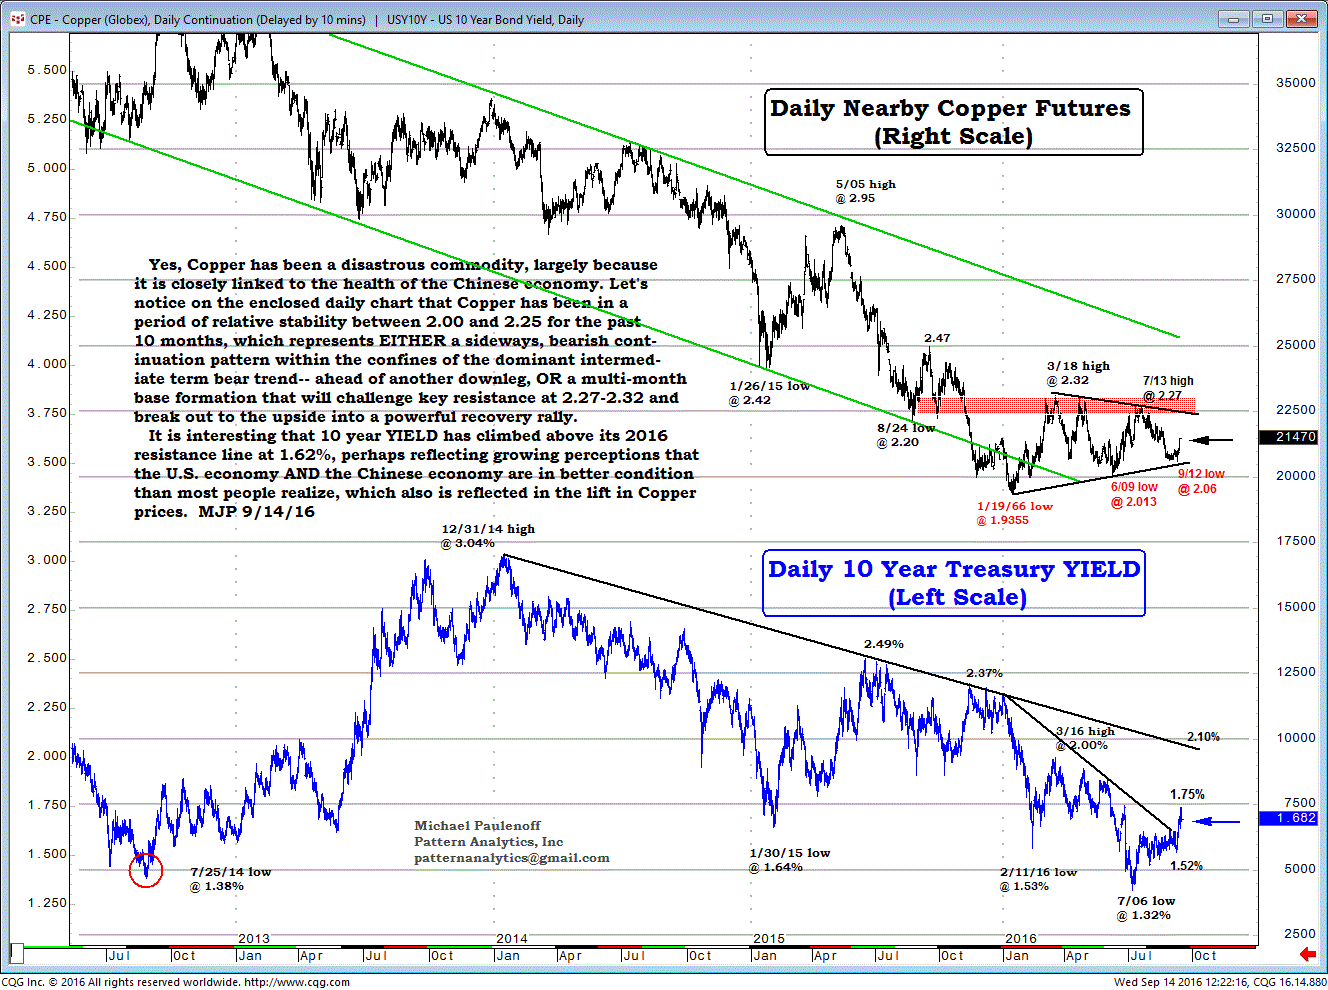
Daily Copper:Daily 10-Y Yield 2012-2016

Latest comments

Loading next article…
Risk Disclosure: Trading in financial instruments and/or cryptocurrencies involves high risks including the risk of losing some, or all, of your investment amount, and may not be suitable for all investors. Prices of cryptocurrencies are extremely volatile and may be affected by external factors such as financial, regulatory or political events. Trading on margin increases the financial risks.
Before deciding to trade in financial instrument or cryptocurrencies you should be fully informed of the risks and costs associated with trading the financial markets, carefully consider your investment objectives, level of experience, and risk appetite, and seek professional advice where needed.
Fusion Media would like to remind you that the data contained in this website is not necessarily real-time nor accurate. The data and prices on the website are not necessarily provided by any market or exchange, but may be provided by market makers, and so prices may not be accurate and may differ from the actual price at any given market, meaning prices are indicative and not appropriate for trading purposes. Fusion Media and any provider of the data contained in this website will not accept liability for any loss or damage as a result of your trading, or your reliance on the information contained within this website.
It is prohibited to use, store, reproduce, display, modify, transmit or distribute the data contained in this website without the explicit prior written permission of Fusion Media and/or the data provider. All intellectual property rights are reserved by the providers and/or the exchange providing the data contained in this website.
Fusion Media may be compensated by the advertisers that appear on the website, based on your interaction with the advertisements or advertisers.
© 2007-2024 - Fusion Media Limited. All Rights Reserved.