Whenever I put the proverbial pen to paper and start to write about gold, I can already hear the chorus of dissenting voices from those traders and investors who only view their beloved metal as bullish, and can never accept the reality of what is actually happening on the charts. This is particularly the case as the recent extended short squeeze for the precious metal has come to an abrupt end in the last few days.
Before moving to an analysis of the chart itself, what is perhaps far more disturbing and worrying for long term investors, is the performance of the metal, particularly given the market panic over the last few days. Indeed, the situation is even stranger considering the demise of the US dollar.
As safe havens go, gold is perhaps the safest of all, and yet during the climactic events of Monday, with equities tumbling fast, and an equally dramatic response in the Japanese yen, gold prices not only failed to rise, they actually fell in tandem with the US dollar. This, perhaps, is the most worrying aspect for long term gold investors, the clear and unequivocal change in market perception of gold, and in particular its role as a safe haven. On such a day, and under ‘normal’ market conditions, gold prices should have been driven higher and dramatically so, given the extreme panic and volatility, yet gold prices closed lower with a doji candle on ultra high volume, signalling indecision at the very least and a possible reversal in due course.
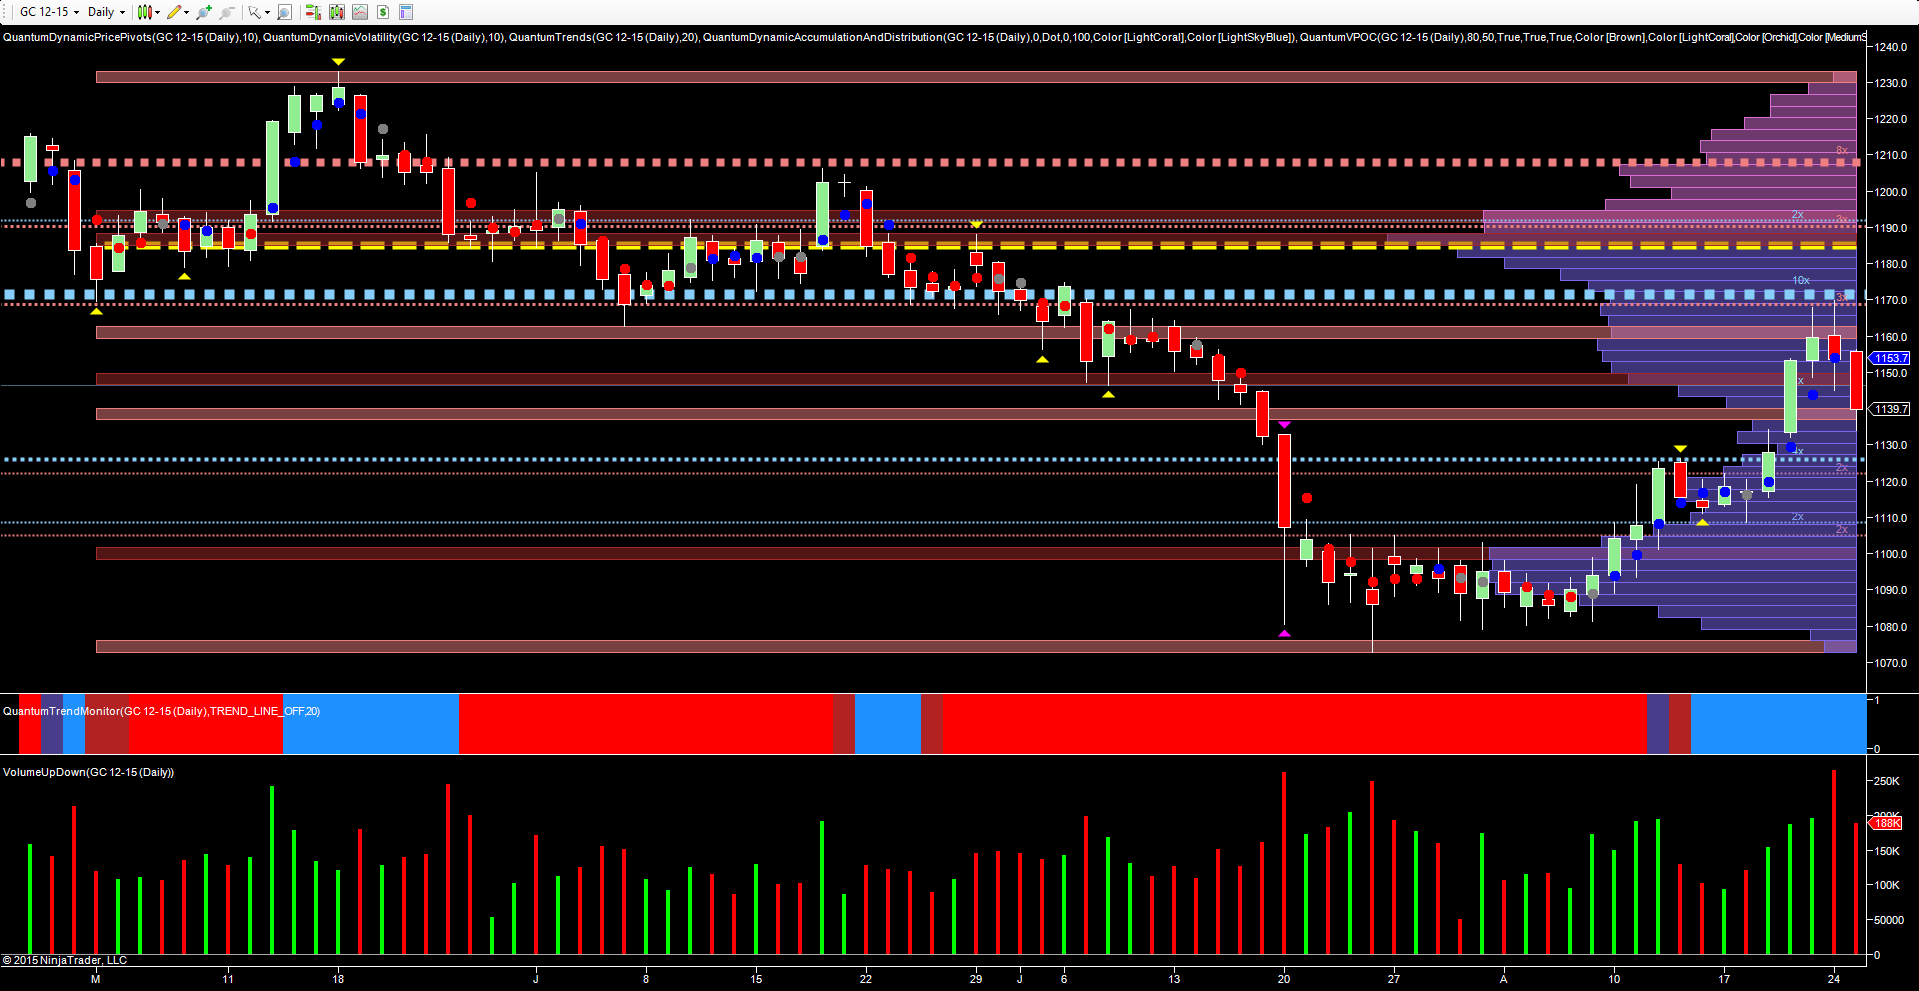
From a technical perspective, the rally of the last few weeks was no great surprise, with the initial phase of buying arriving on the 20th July, followed by a second and further phase of stopping volume on the 24th July, with both candles associated with high or ultra high volumes. The remainder of the mopping up operation was then duly completed over the next two weeks, with the rally then developing before finally topping out on Monday, having tested the well developed resistance level at the $1170 per ounce region, as denoted by the blue dotted line.
This level was also tested on Friday and duly held, with the VPOC indicator also delivering a high volume node in the $1160 per ounce region, which has added further downwards pressure. Yesterday’s price action saw gold move firmly lower to test the low volume node now in place at $1140 per ounce. Once this is breached, we can then expect to see the price of gold move to test the $1125 per ounce region with any move through here likely to take the precious metal down to test the high volume node waiting in the $1100 per ounce area.
Longer term, gold remains very bearish, and the recent rally is reminiscent of many we have seen in the past, which have all failed to deliver any sustained change in trend or sentiment. Given the performance of the metal over the last few days, any reversal in the longer term trend is only likely to arrive once gold reverts to its traditional hedge against inflation.
Some time off I think, and until then we are likely to see further declines punctuated by weak rallies, as the longer term bearish trend continues to grind its way lower.
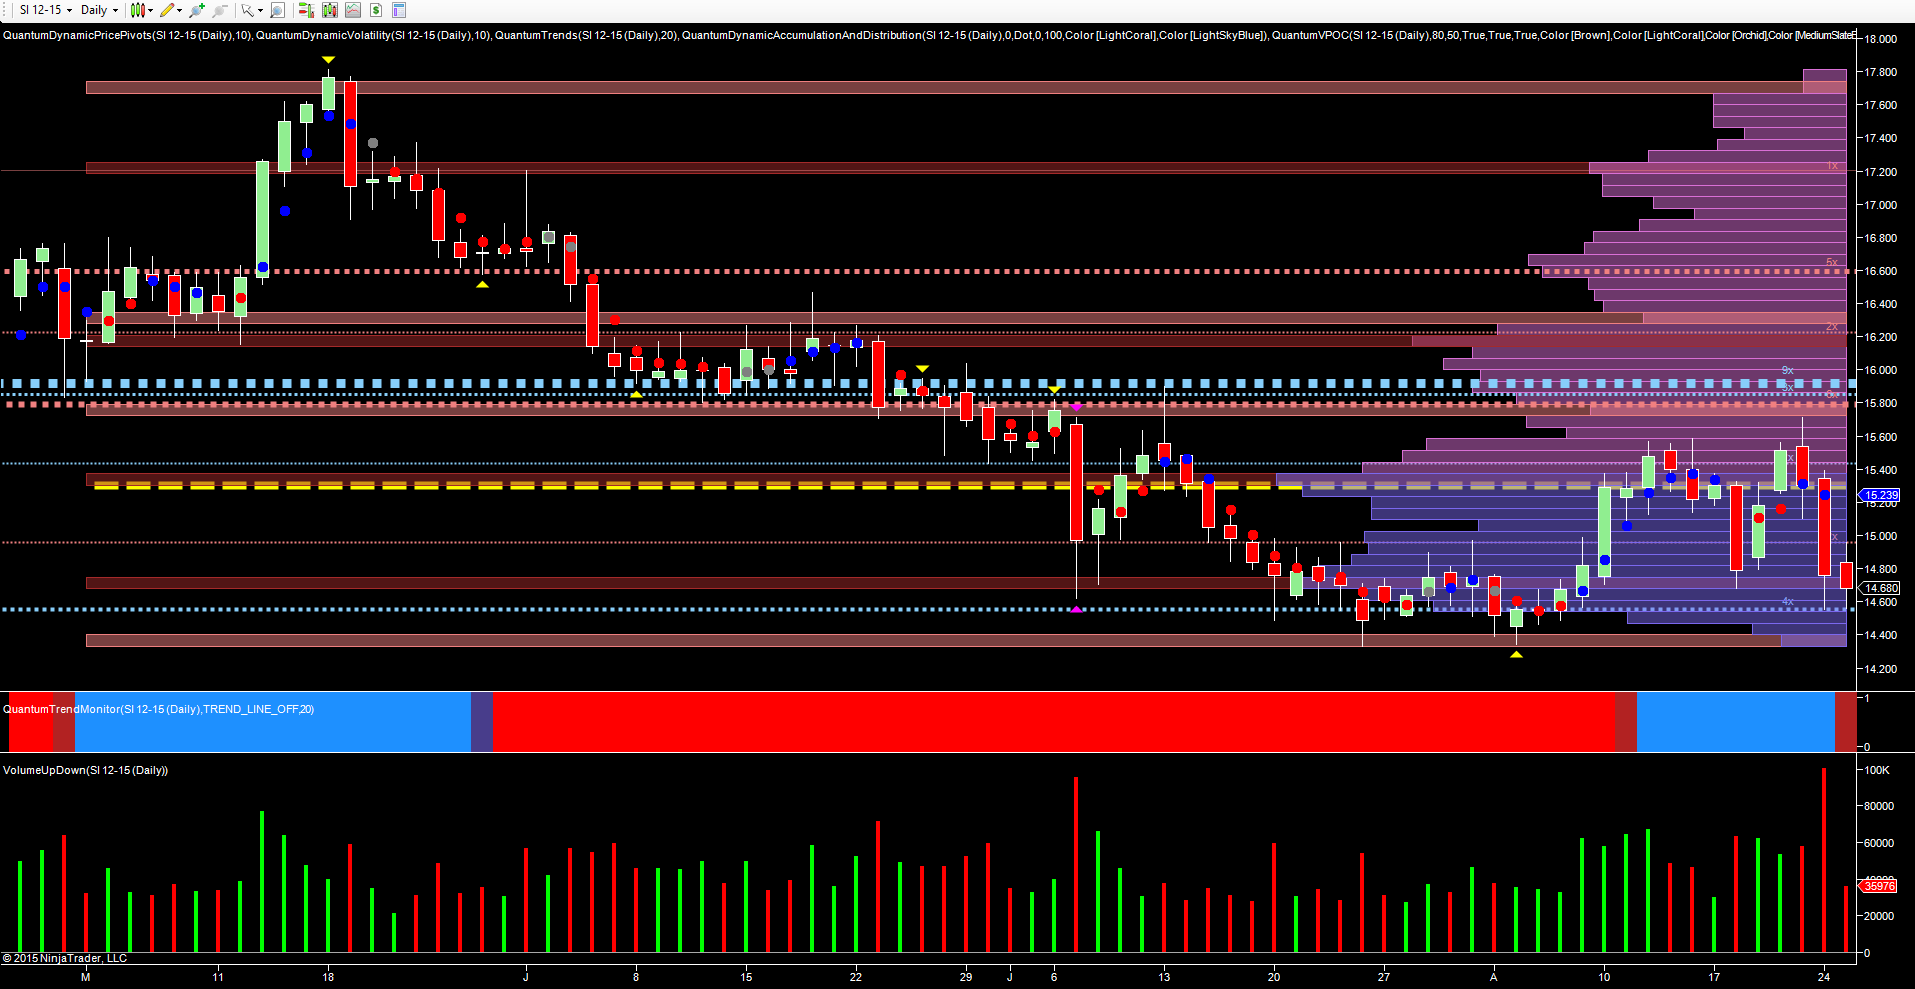
What is perhaps also equally revealing is gold’s sister metal silver. While mirroring the move higher for gold, in comparative terms, its rally too has been very weak. Indeed, the metal has been moving less that $1 per ounce in this period, as it continues to oscillate around the VPOC at $15.30 per ounce.
Monday’s wide spread down candle once again confirmed the weakness of the move higher, with extreme volume then confirming the heavy selling pressure on the day, as the support platform at $14.58 was tested once again, with yesterday’s price action probing this level for a second consecutive day, but on substantially lower volumes. The $14.40 per ounce level is now key. With a low volume node now awaiting, the outlook for silver remains very bearish in the longer term.


