- S&P 500 on the cusp of a downtrend
- Dollar attempts reversal
- Oil prices reinforce bearish economic view
- Current SPX level predicts Biden win
An array of fundamentals—including rising COVID-19 cases in the US and globally; a bitter stalemate among Congressional lawmakers over another round of fiscal stimulus; an acrimonious US presidential election; and disappointing earnings releases from some of the country's biggest companies—fueled last week's equity declines. Many of the same triggers, some of which paint a picture of a slowing economy, could weigh on markets again in the coming week.
On Friday, stocks fell for the fourth day out of five, sealing the third weekly loss in a row. Last week's drop was was also the worst since the 15% selloff in March, when shares suffered their biggest rout since the 2008 financial crisis. The March selloff led to a market bottom. Will this selloff, during the final week of October, prove to be a bottom as well?
What's The Message When Stocks Sell Off Before An Election?
The NASDAQ 100 dropped about 2.6% after both Apple’s (NASDAQ:AAPL) iPhone sales and Twitter (NYSE:TWTR) user growth disappointed expectations. Alphabet (NASDAQ:GOOGL) posted a rebound in advertising, boosting the stock.
The S&P 500 Index plummeted 5.6%, the worst loss on record for the broad benchmark in the week leading up to a presidential election. As a rule, stocks tend to climb ahead of elections.
It would, of course, be understandable if shares were in a holding pattern, awaiting the outcome. But what does it say when stocks suffer a sharp selloff before the victor is announced?
Could investors be pricing in the expected results? Or are they concerned that if President Donald Trump loses, he won’t accept the conclusion and instead drag the nation into a protracted legal battle regarding the outcome?
We can't, of course, know who the next president will be, but we can glean a few hints regarding where markets think the election is headed, based on recent activity.
If the election were held today, according to market signals, Joe Biden would win. Since 1928, whenever stocks were down in the three-month period before elections, the incumbent lost 87% of the time. That statistic has worked 100% of the time since 1984.
As of now, the S&P 500 is down 0.77% over the past three months, thanks to last week’s rout. Unless stocks rebound significantly, the market is predicting that President Trump is heading for a loss, at least on a statistical basis.
Still, what does that actually prove? As we all know, markets are notoriously unpredictable.
In 2016, a Clinton win was the overwhelming consensus. At the time, Ray Dalio, co-chief investment officer of Bridgewater Associates, the world's largest hedge fund, predicted that if the unthinkable occurred and Trump won, markets would tank. As we know, Trump won and markets jumped...for a while.
Now, some are predicting that a Trump victory, given his protectionist agenda and lack of clarity on policy, could tip the world into a global recession. In other words, anything can happen.
What we do know is this: there are now two layers of uncertainty: (1) who will win, and (2) what it will mean to markets.
For the moment, all we've got are technical positioning. Here's what the charts say:
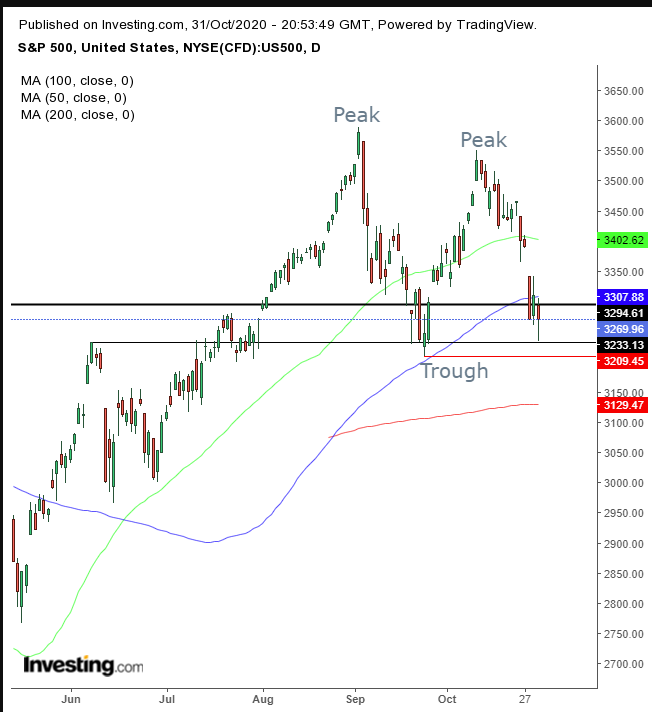
Since Aug. 3, the SPX has fallen into negative territory (thick, black line), marking the beginning of the 3-month period before elections. As of now, the price closed below the 100 DMA, which proved to be a resistance when the price attempted to cross above it but failed.
Ever since the June high, the level over 3,200 has become an important support-resistance area. A low below the Sept. 24 trough would complete a short-term trend reversal.
A corollary to last week's equity selloff: Treasury yields, including for the 10-year benchmark, rose on the outlook for more stimulus after the election.
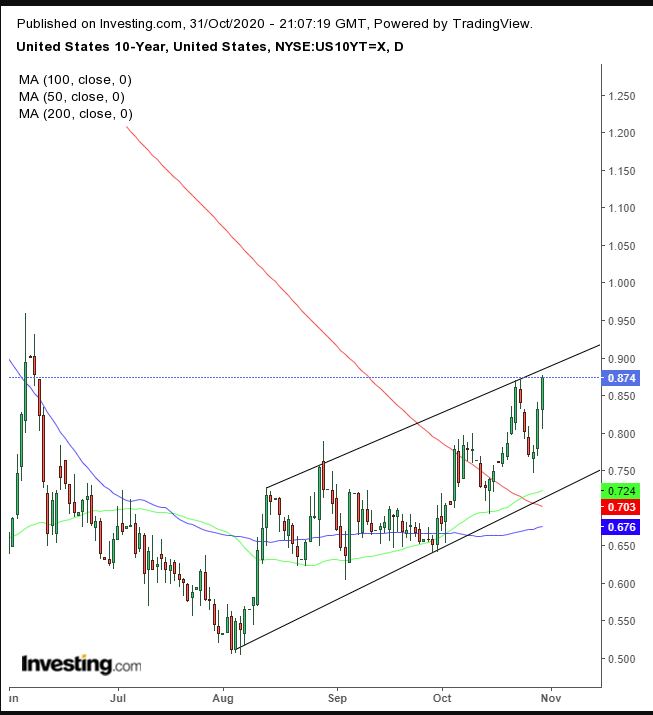
Yields climbed for three straight days last week, to their highest level since June 8, pulling the 50 DMA above the 200 DMA. This triggered a golden cross, as rates retest the Oct. 23 high and rising channel top.
The dollar strengthened despite the Treasury selloff, as investors shifted into cash.
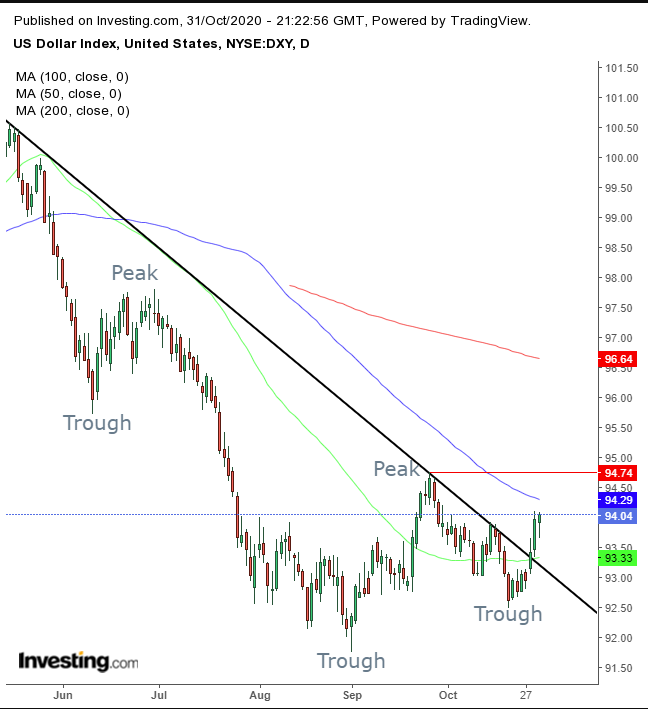
On Friday, the USD extended its penetration above the downtrend line since the March high for a third day. If it can cross the 94.74, Sept. 25 high, it will have established a short-term uptrend.
Gold gained, due to its safe haven status amid the sharp equity selloff and notwithstanding the dollar’s rise.
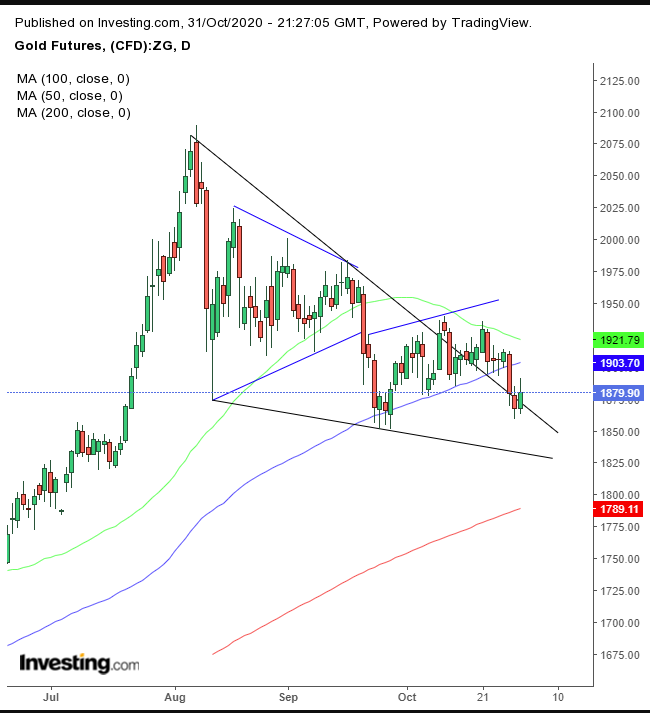
The precious metal's forces of supply and demand continue to struggle between a bullish wedge and a bearish flag, whose bottom is part of the 100 DMA.
Bitcoin closed out the week at its highest point since Jan. 13.
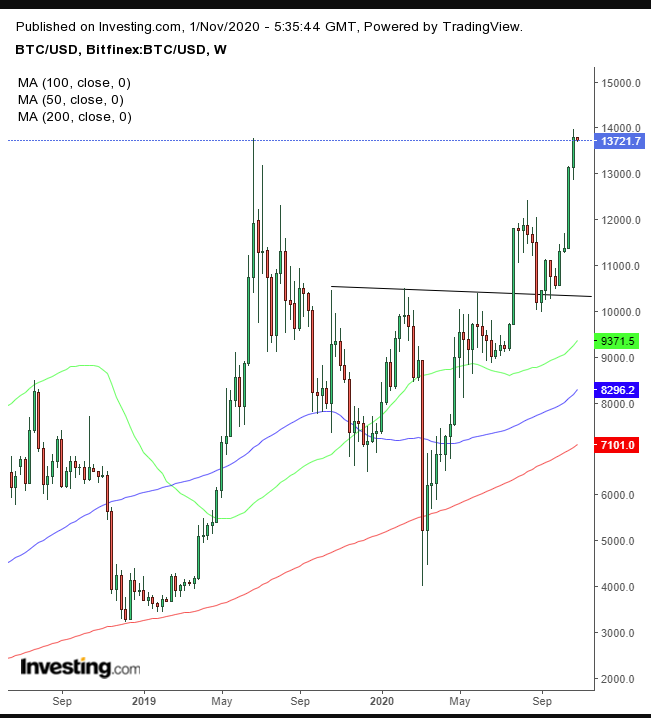
This established a medium-term uptrend for the cryptocurrency. BTC has now actualized our short-term pattern and confirmed our long-term forecast.
The combination of escalating COVID-19 cases and no additional room for large producers to cut production, combined with a rising dollar, pushed oil to a five month low.
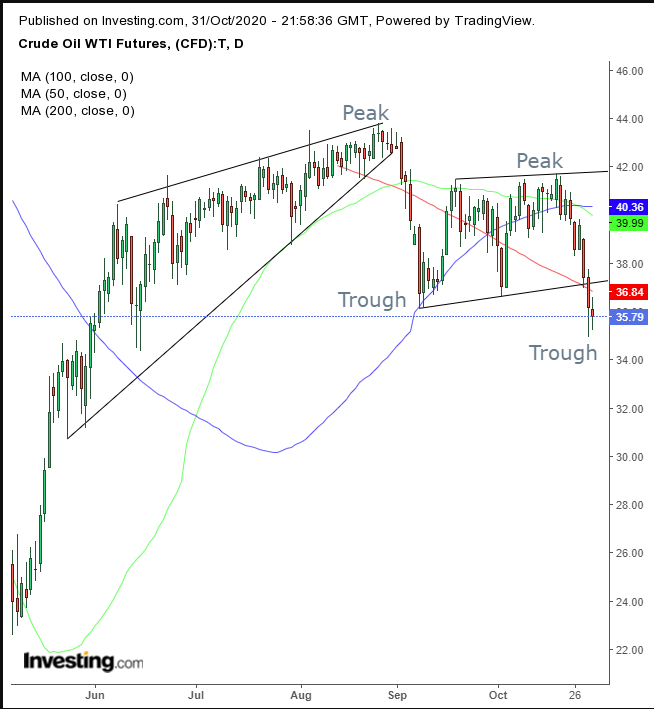
WTI fell on Friday for the second day, dropping below a range that signals a resumption of the new downtrend after completing a bearish wedge.
The Week Ahead
All times listed are EST
Monday
4:30: UK – Manufacturing PMI: anticipated to remain steady at 53.3.
10:00: US – ISM manufacturing PMI: expected to edge up to 55.8 from 55.4.
22:30: Australia – RBA Interest Rate Decision: predictions are for a rate cut to 0.10% from 0.25%.
Tuesday
All Day: US – Presidential Election
16:45: New Zealand – Employment Change: forecast to fall to -0.8% from -0.4% previously.
18:50: Japan – Monetary Policy Statement
20:30: Australia – Retail Sales: seen to rise to -1.5% from -4.0%.
Wednesday
4:30: UK – Composite PMI: likely slipped lower, to 52.9 from 56.5.
8:15: US – ADP Nonfarm Employment Change: expected to fall to 650K from 749K.
10:00: US – ISM Non-Manufacturing PMI: forecast to have crawled up to 57.5 from 57.8.
10:30: US – Crude Oil Inventories: came in last week at 4.320M.
Thursday
4:30: UK – Construction PMI: anticipated to slump to 55.0 from 56.8.
7:00: UK – BoE Interest Rate Decision: consensus keeps rates at 0.10%.
9:30: US – Initial Jobless Claims: predictions are for a jump to 770K from 751K.
14:00: US – Fed Interest Rate Decision: rates expected to remain steady at 0.25%.
14:30: US – FOMC Press Conference
Friday
8:30: US – Nonfarm Payrolls: predicted to rise to 700K from 661K.
8:30: US – Unemployment Rate: seen to edge down to 7.6% from 7.9%.
8:30: Canada – Employment Change: forecast to plunge to -7.5K from 378.2K.
10:00: Canada – Ivey PMI: previous reading was 54.3.
