- Major indices fall; S&P 500 enters official correction territory
- Treasuries rise, boosting dollar, further pressuring oil and commodities
- Bitcoin falls below $4,000
Oil's slide toward $50 weighed on equities last week. Friday's stock market losses for the Dow and NASDAQ Composite capped a tough week for both major indices. However, the most significant losses were for the S&P 500, which after its 0.66% decline on the final day of trade during the holiday shortened week, slipped into an official correction as it hit cumulative losses of 10 percent.
The benchmark was pulled down by energy companies tracking oil’s fall to its lowest level in a year. Crude’s oversupply also pressured commodity prices. The dollar climbed in tandem with Treasuries, adding to the pressure.
Weekly Selloff Leaves Every Sector In the Red
The S&P 500 Index declined 0.66 percent Friday, dragged down by Energy sector shares (-3.14 percent), with companies like Devon Energy (NYSE:DVN) and Marathon Oil (NYSE:MRO) losing at least 4 percent each. Communication Services (-1.31 percent) was the second-worst performer, though it lagged Energy by almost two percent.
On a weekly basis, the benchmark extended the selloff by 3.79 percent, or 5.34 percent for the second straight week, completing the 10 percent dip required for the index to be considered in a correction. The price reached the lowest level since May 3, over half a year ago.
The weekly decline over the 3-and-a-half-day trading week, was its third worst Thanksgiving week performance since 1939. Technology underperformed (- 6.05 percent). The tech selloff was more significant than falling oil prices—Energy dropped (-4.87 percent).
Every sector was in the red with losses of at least 1 percent. Utilities were the best relative performers with losses of just 1.4 percent.
The Dow Jones Industrial Index underperformed on Friday, falling 0.73 percent. However, with a 9.54 percent decline from its October 3 record close, it is the only benchmark not yet in correction. While this may be seen as a sign of strength, it’s important note that it was already at a lower level before the most recent selloff since trade war fears had already depressed the mega-cap index.
Multinational companies listed in the benchmark rely heavily on exports for growth. Also, despite the Dow being the only major index not in an official correction, it underperformed both for the week (-4.44 percent) and for the last two weeks (-6.62 percent).
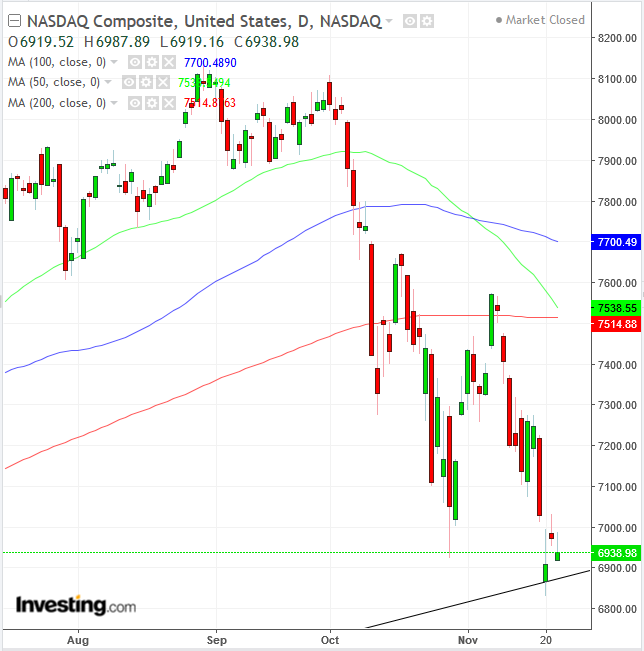
The NASDAQ Composite dropped Friday 0.48 percent, 4.26 percent for the week and 6.32 percent for both weeks. While, it has been the worst performer during this rout, falling 14.68 percent since its highest close on August 29, passing the 15% threshold on Wednesday's low, it bounced off its long-term uptrend line since the previous correction in 2016. Technically, the 50 DMA is about to cross below the 200 DMA.
The Russell 2000 outperformed on Friday, falling only 0.27 percent. It capped a 2.54 percent slide for the week and a 3.85 percent decline for the second straight week. Technically, the moving-average interplay executed a death cross last week, when the 50 DMA fell below the 200 DMA. The small-cap index is the second-worst performer after the NASDAQ during this rout, falling 14.83 percent since its highest close in August.
Six Key Risks for Equity Markets
Equity markets are currently facing six key risks:
- Trade war: it may have already ended the first synchronized growth since the Great Recession,
- China’s economic slowdown: a result of the trade tussle, the world’s second-largest economy is reducing demand which will have an adverse chain reaction on other economies.
- Germany’s economic slowdown: same reasons, similar repercussions.
- Fed tightening: fears persist that rising rates will end the most extended bull market on record.
- Waning oil demand: sinking prices are hitting equity and commodity markets.
- Tech selloff: the sector's heavy weighting on major indices could add additional strain if shares continue to be jettisoned.
On the other hand, since the US economy is still robust as it continues to show signs of health, investors may decide to buy stocks at a holiday discount. Retail sales, the backbone of the American economy, are in great shape heading into the holiday shopping season.
With unemployment at multi-decade lows and rising wages, moderate inflation and falling oil prices, there's a sense "there's plenty more where that came from." Even after the recent retail upheaval wherein brick-and-mortar sales have been transforming into e-commerce purchases, retail sales are forecast to climb 5 percent since last year, which is only slightly lower than the 5.6% gains for this metric seen in the previous year.
Ironically, the current risk-off mood is at odds with the buoyancy among consumers, whose online shopping over Thanksgiving is forecast to reach a record this year. What’s bothering investors is a prevailing fear that things are as good as they can be. From corporate earnings to the economy, a slowdown looks likely after one of the longest expansions on record.
Investors have sought safety in companies that offer stable income and high dividends, like utilities and consumer staples, since the S&P 500 started a retreat last month that morphed into its second 10 percent correction of the year. So much love has been placed with safety shares that JPMorgan strategists, led by Dubravko Lakos-Bujas, said their valuations relative to risky stocks suggest the market is, perhaps wrongly, “starting to price in a recession-like scenario.”
“We view the current style dislocation as overdone and inconsistent with the fundamental backdrop,” the JPM strategists wrote in a note earlier this week. “The business cycle slowdown concerns are largely premature.”
A note on fundamental and technical analysis: though during the middle of a market move, fundamentals and technicals often agree, they are generally at odds during market turns since smart-money stays ahead of the curve, before the fundamentals are known.
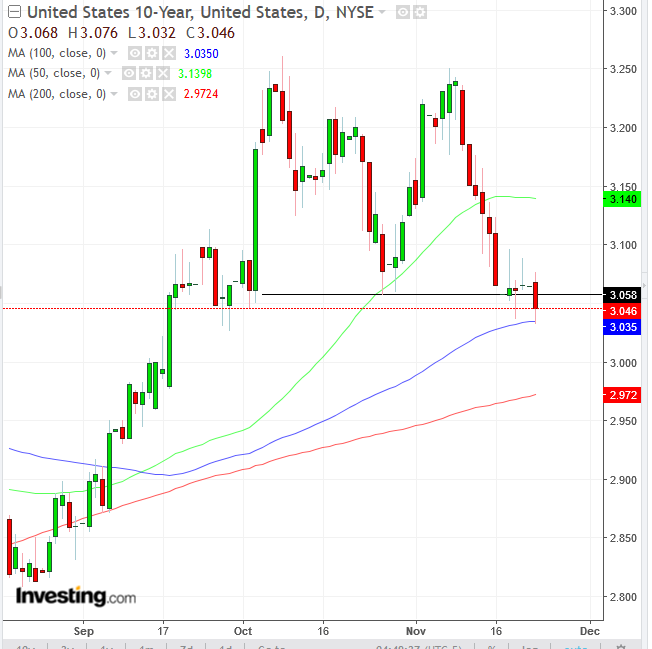
The yield on 10-year Treasurys fell below the October low, after failing to scale above the October peak this past month, completing a double top reversal. So far, it found support by the 100 DMA. Should it fall below the 3.00, it will likely continue to sink lower. A drop below the 200 DMA would suggest a deeper decline toward 2.900 percent.
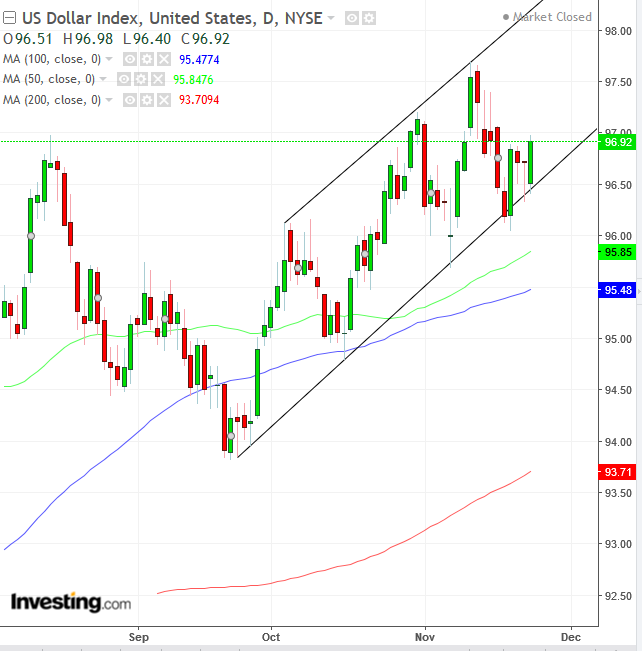
The higher demand for Treasuries by foreign investors boosted the dollar, which has already buoyed by its current haven status. Technically, demand for the global reserve currency kicks in at the bottom of its rising channel.
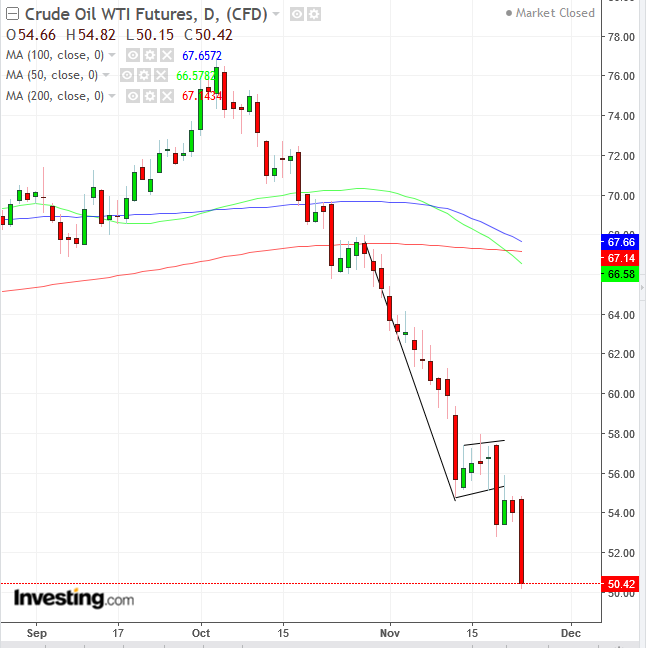
On Friday, oil reached a cumulative stumble of 6.66 percent, a devilish slide by some measures. The reality of the plunge is perhaps of equal concern: US President Donald Trump continues to pressure Saudi Arabia to keep prices down, and the equity rout plays on fears that the end is nigh for economic growth and with it the demand for energy.
Ironically, there's a not-so-virtuous loop being formed, feeding on itself, with Friday’s stock selloff triggered by falling oil prices, whereupon equities fall yet more, pressing on commodities yet again. Technically, the price retested a bearish flag, found resistance and is potentially repeating the 19% drop it for the commodity seen from October 29-November 13. The 50 DMA crossed below the 200 DMA, executing a death cross, a technical phenomenon that receives substantial attention, even by non-technical traders.
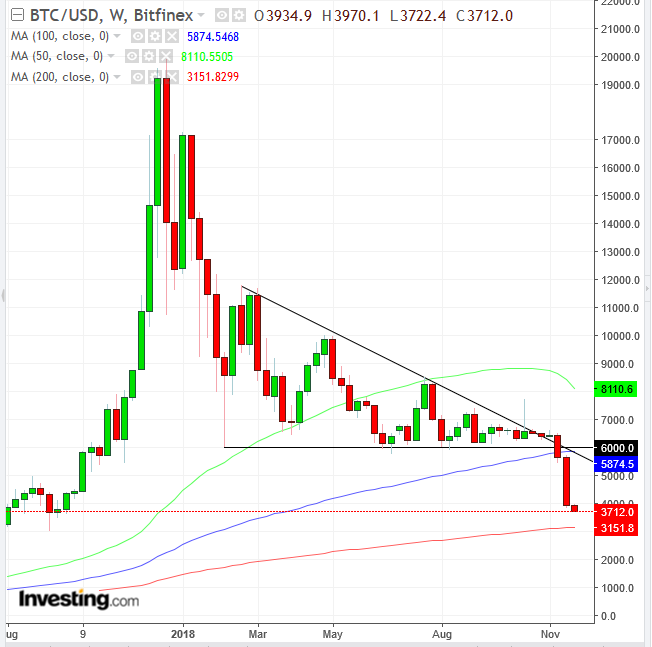
Bitcoin fell 4.4 percent on Sunday, to $3,752 at time of writing, for the second day of losses. That's an aggregate loss of 15% over the two day period and more than 35% since we suggested in mid-November that the cryptocurrency was set to slump toward $3,000.
The current 13-month low has polarized digital currency analysts, with some saying the asset class is history because it’s just too confusing, while others have been ramping up their calls of a bottom being reached.
The Week Ahead
All times listed are EST
Sunday
19:30: Japan – Manufacturing PMI (November, flash): forecast to rise to 53 from 52.9.
Monday
4:00: Germany – IFO (November): business climate index to rise to 102.3 from 102.8.
8:30: US – Chicago Fed National Activity Index (October): expected to increase to 0.4 from 0.17.
Tuesday
10:00: US – Consumer Confidence (November): expected to fall to 135.5 from 137.9.
Wednesday
2:00: Germany – GfK Consumer Climate (December): forecast to fall to 10.5 from 10.6.
830: US – GDP (Q3, 2nd estimate): growth to rise to 3.6% QoQ from 3.5%.
10:00: US – New Home Sales (October): forecast to grow 4.5% MoM from a 5.5% drop a month earlier.
10:30: US – EIA Crude Inventories (w/e 23 November): stockpiles forecast to rise by 2.5 million barrels.
12:00: US – Fed Chair Powell Speaks: this is a potentially high-volatility event for markets at any time, but Powell's words are also being pointed to by President Trump, as a key catalyst for the equity rout. The US president added an additional blow on Friday by blaming Secretary Mnuchin for appointing the Fed chair.
Thursday
3:00: Eurozone – ECB President Draghi Speaks: After hinting last week of a possible dip in inflation, how will the European Central Bank president open a crucial week as the bond-buying exit decision nears amid an ailing eurozone still hooked on QE?
3:55: Germany – Unemployment Rate (November): unemployment rate to hold at 5.1%.
5:00: Eurozone – Business Climate (November): forecast to fall to 0.96 from 1.01.
8:00: Germany – Inflation (November, preliminary): prices to rise 2.3% YoY from 2.5%.
8:30: US – Personal Income and Spending (October): income to rise to 0.4% from 0.2% MoM; spending to remain steady at 0.4% MoM.
10:00: US – Pending Home Sales (October): sales to rise 0.8% from 0.5% MoM.
14:00: US – FOMC Minutes: no change was made in policy, but the minutes will be key for USD movement this week.
18:30: Japan – Unemployment Rate (October): rate to rise to remain flat at 2.3%.
20:00: China – Manufacturing and Non-Manufacturing PMI (November): manufacturing PMI to remain flat at 50.2, while non-manufacturing PMI to edge down to 53.8 from 53.9.
Friday
00:00: Japan – Consumer Confidence (November): confidence forecast to edge up to 43.3 from 43.
5:00: Eurozone – Unemployment Rate (October), Inflation (November, flash): expected to edge down to 8.0%. from 8.1% unemployment; CPI to edge down to 2.1% from 2.2% CPI YoY and core CPI to remain flat at 1.1% YoY.
8:30: Canada – GDP (Q3): growth to fall to 0.3% from 0.7% last month.
9:45: US – Chicago PMI (November): forecast to rise to 58.6 from 58.4.
