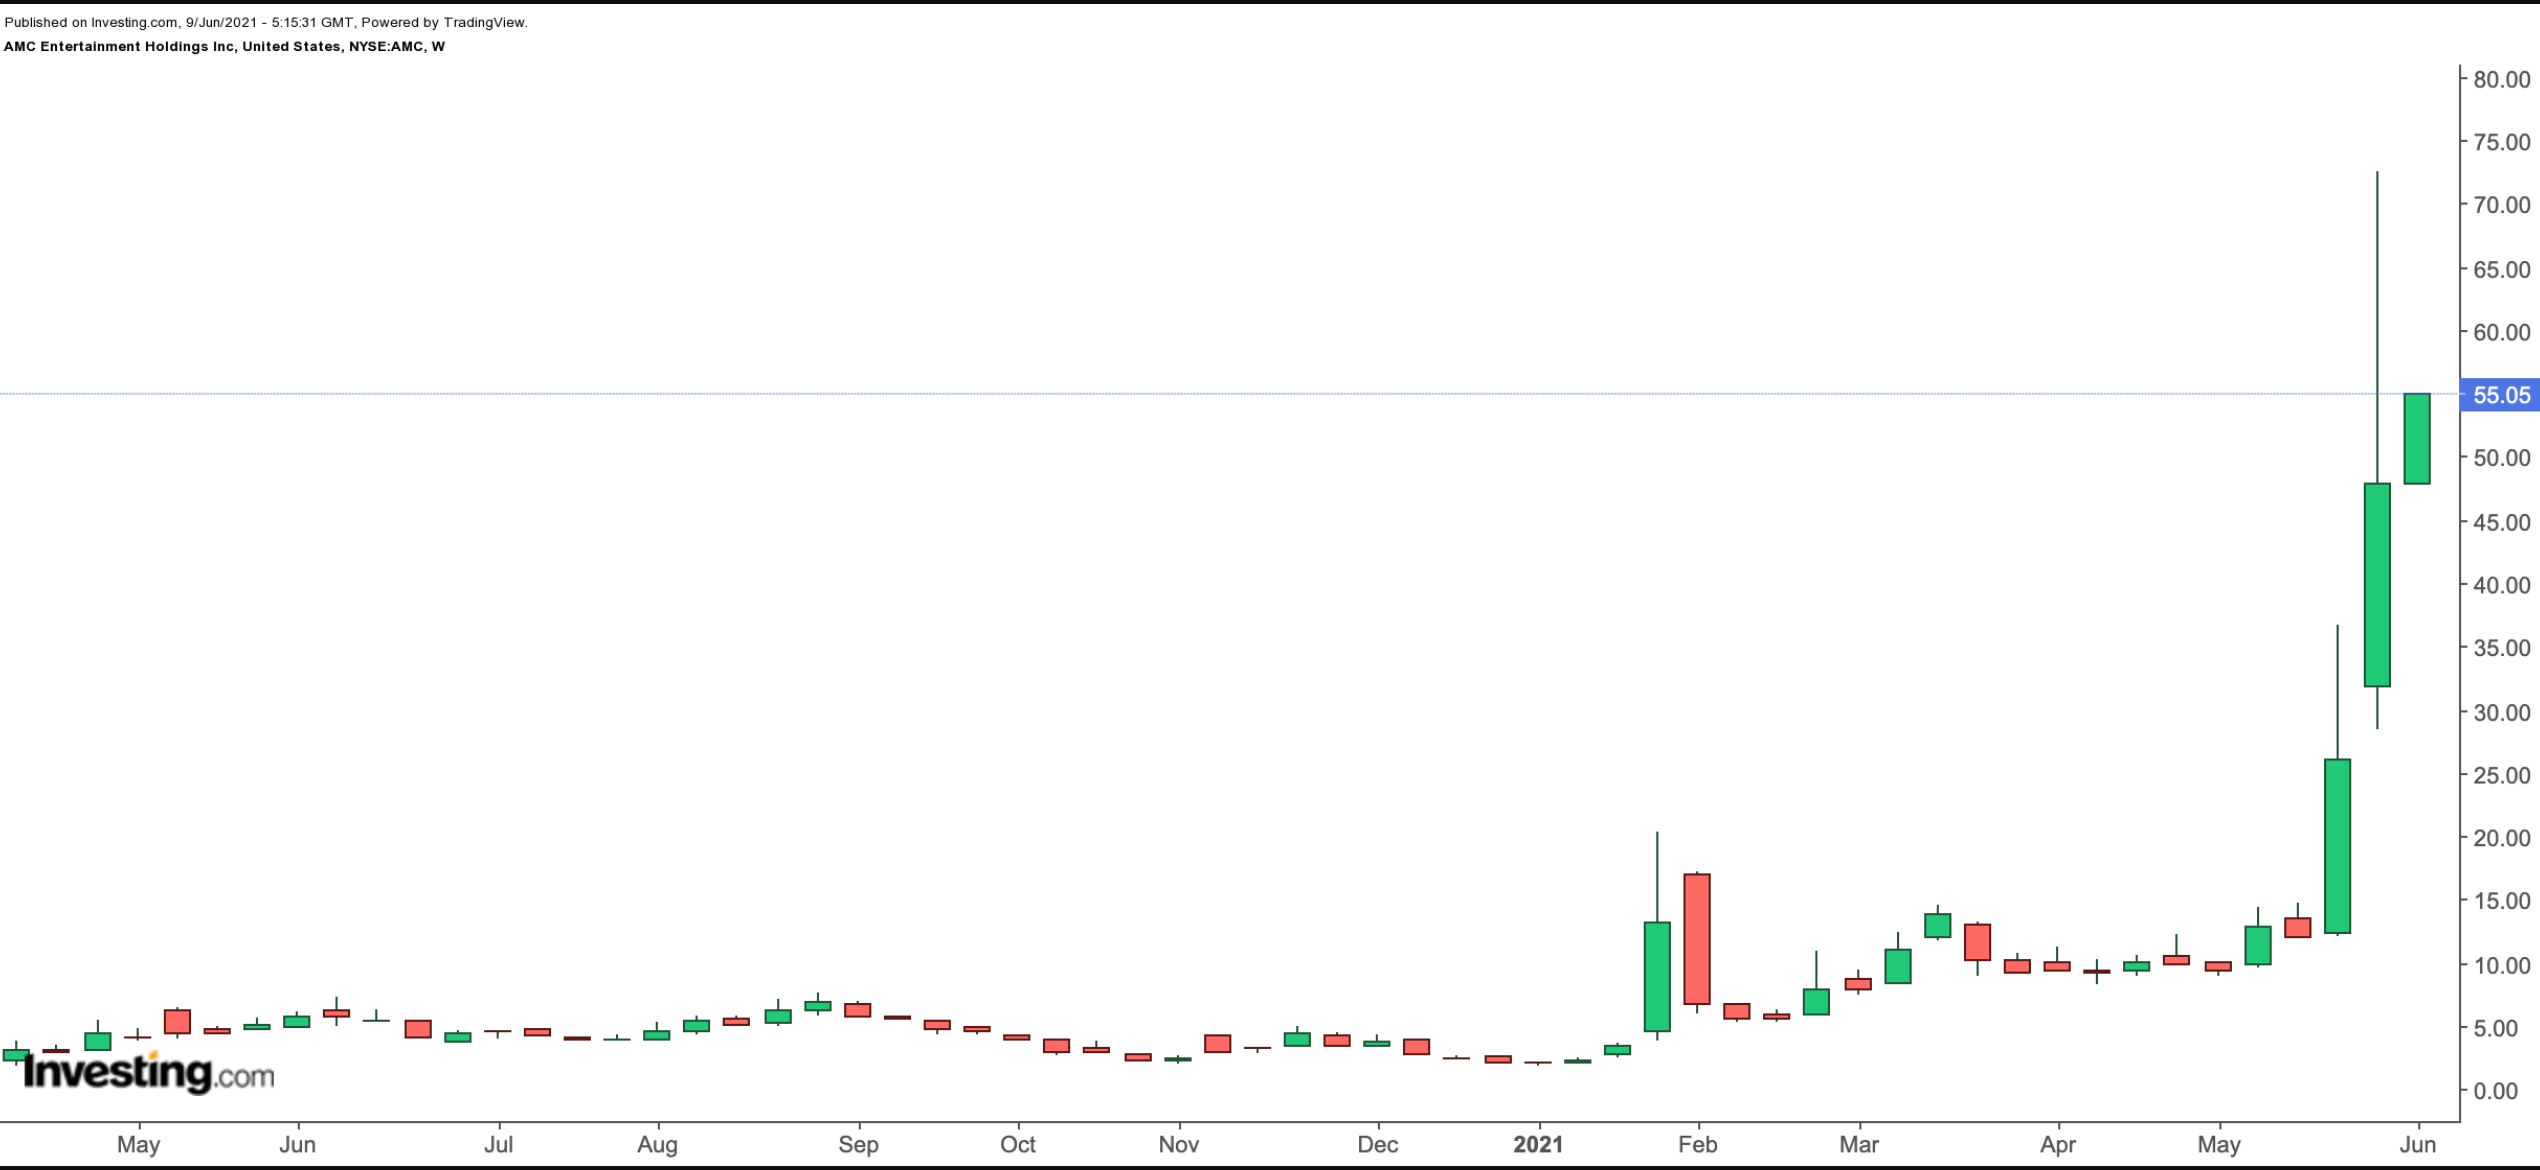
This has become the year when “meme stocks,” like movie theatre operator, AMC Entertainment (NYSE:AMC), have captured Wall Street’s imagination. So far in 2021, AMC shares are up about 2,600%.
That means the proverbial $1,000 invested in early January would now be worth around $26,000. In recent days, the shares saw an all-time high of $72.62. They are now hovering around $60.

Similarly, two other meme stocks have been making headlines. Year-to-date, omni-channel retailer, GameStop (NYSE:GME) and Canadian technology group, BlackBerry (NYSE:BB) have returned 1,570% and 160%, respectively.
On Tuesday, as we write, another stock, Clover Health Investments (NASDAQ:CLOV), has become the latest meme stock darling. Intraday, it is up more than 65%. Traders on social media groups like Reddit’s Wallstreetbets, have jumped in to participate in the rally. Meanwhile, short-sellers, many of which are institutions, have been getting “squeezed.”
It is hard to argue against returns like this. However, the volatility that comes with the meme-stock craze may not be appropriate for most retail investors.
Therefore, today we introduce two exchange-traded funds (ETFs) that hold AMC. Interested readers could consider doing further due diligence on these funds, which would also give exposure to one or more of the current meme stocks.
1. First Trust Mid Cap Growth AlphaDEX Fund
Current Price: $73.13
52-Week Range: $44.54 - $75.47
Dividend Yield: 0.22%
Expense Ratio: 0.70% per year
The First Trust Mid Cap Growth AlphaDEX® Fund (NASDAQ:FNY) provides exposure to mid-cap growth stocks selected from the NASDAQ US 600 Mid Cap Growth Index. The companies are ranked based on price appreciation, sales-to-price ratios and sales growth. The fund, which started trading in April 2011, is rebalanced quarterly.

FNY tracks the NASDAQ AlphaDEX Mid Cap Growth Index. Top sectors include information technology, (19.40%), health care (19.13%), consumer discretionaries (16.36%), industrials (12.09%) and financials (6.34%).
The fund currently has 225 stocks. The 10 leading holdings comprise 11.6% of FNY’s net assets of almost $414 million.
AMC Entertainment; Sweden-based biotechnology group Olink (NASDAQ:OLK); oil and gas exploration company APA (NASDAQ:APA); Celsius (NASDAQ:CELH), which develops calorie-burning beverages; and medical device group Shockwave Medical (NASDAQ:SWAV) top the list of current holdings.
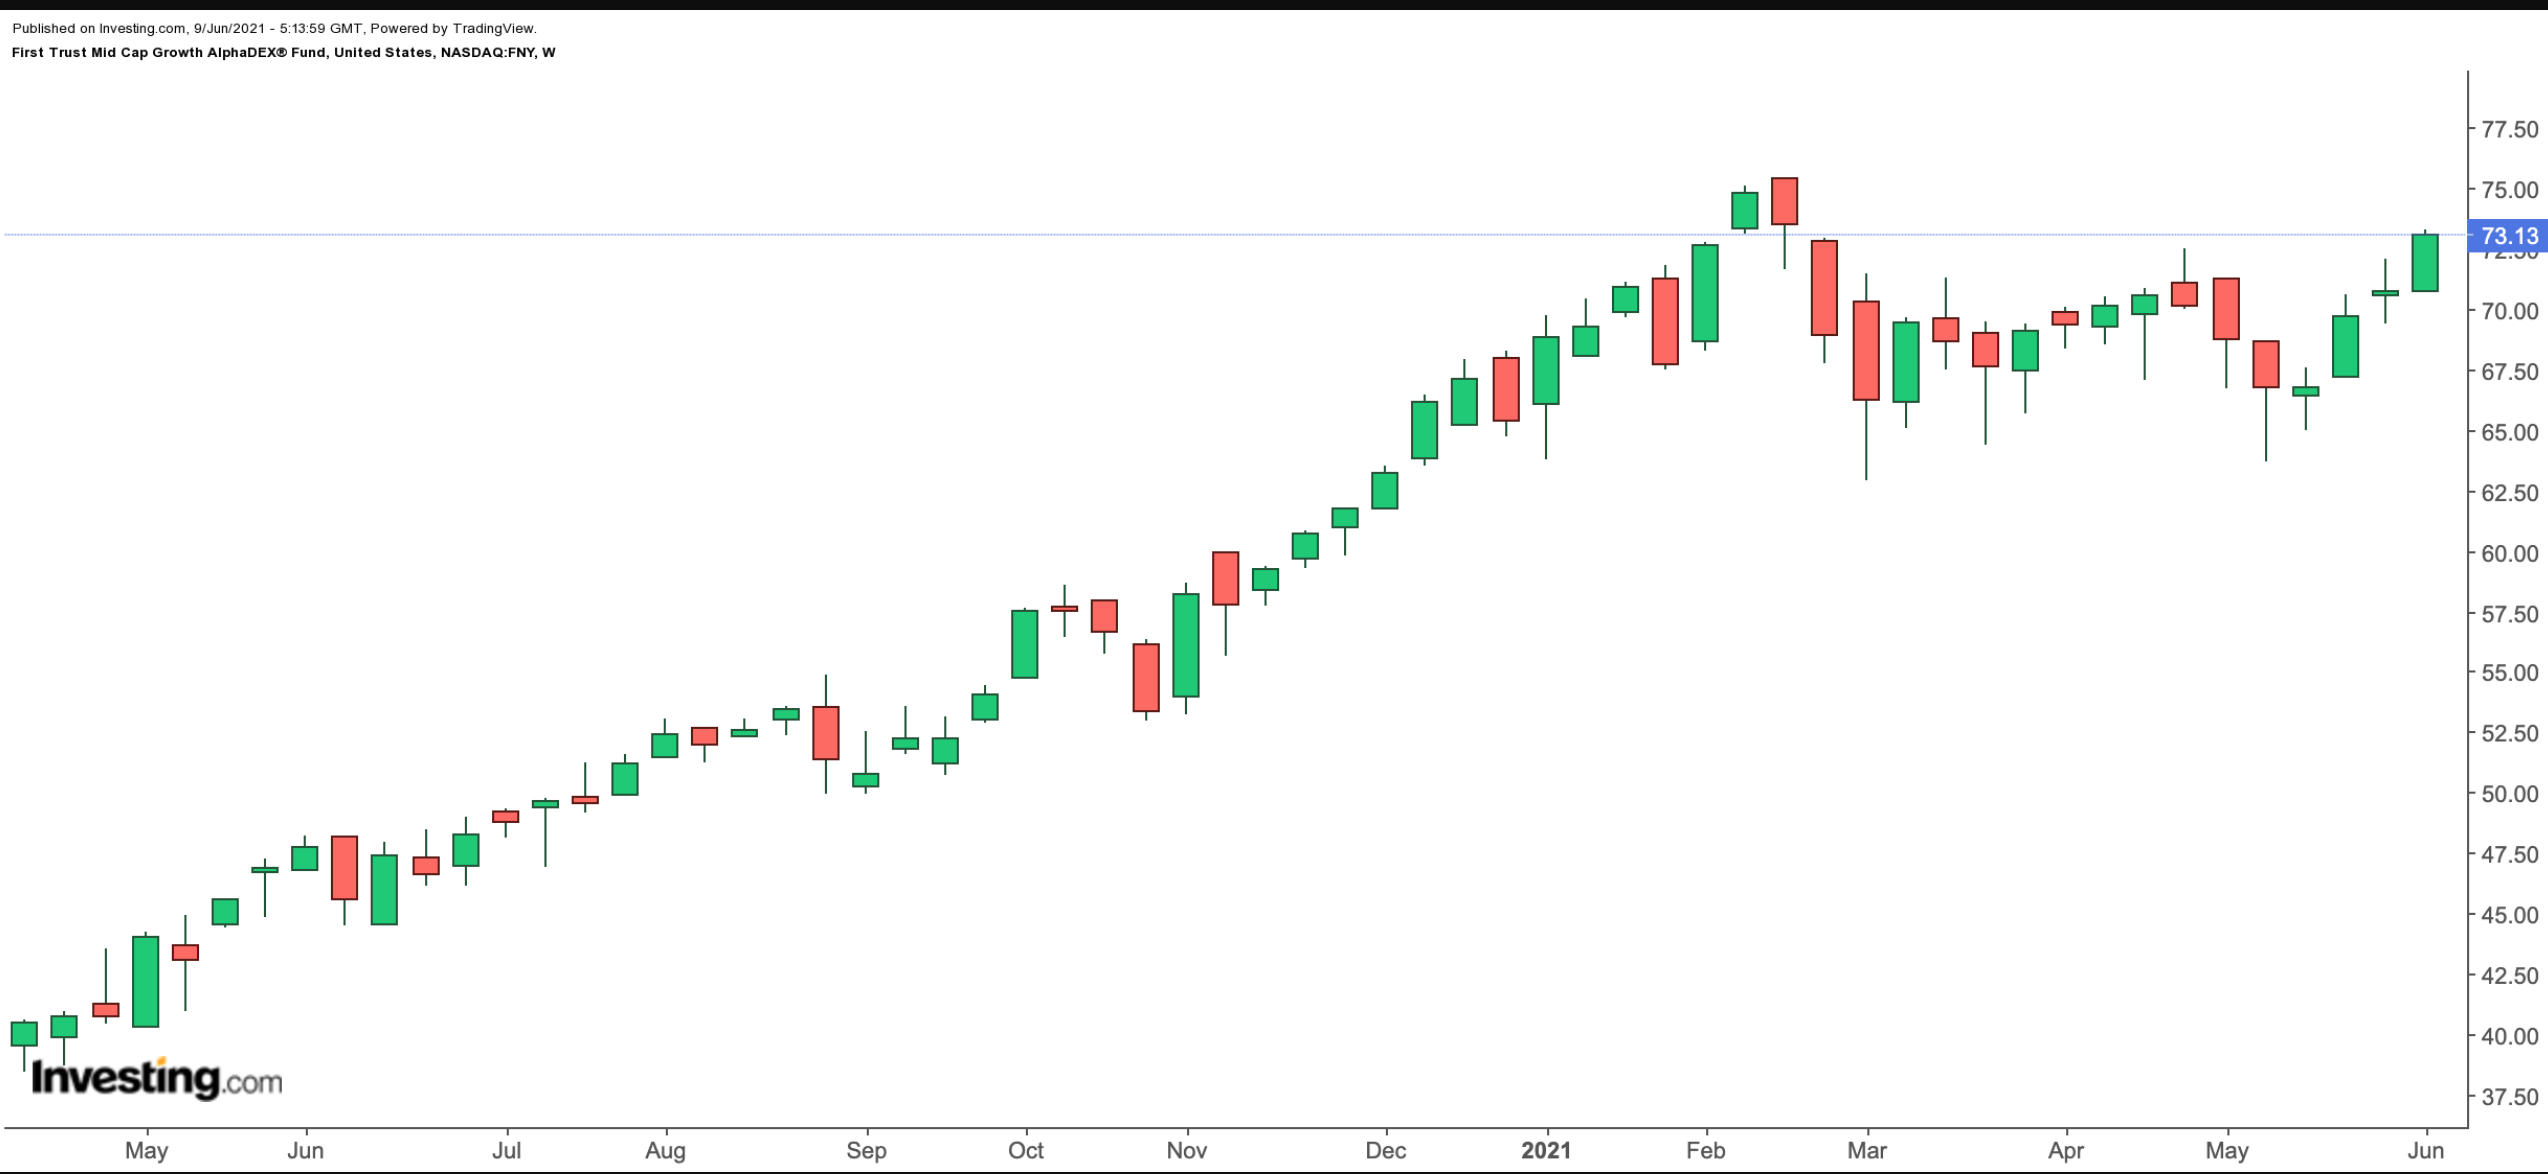
So far this year, FNY is up about 10.5%, hitting a high of $75.47 in mid-February. Over the past 52 weeks, the fund has returned more than 51%. Small- and mid-capitalization companies, generally, carry higher growth prospects than large-cap firms.
Investors should keep FNY on their radar, as it outperforms via a portfolio of selected mid-cap growth equities.
2. SoFi Social 50 ETF
Current Price: $38.80
52-Week Range: $18.35 - $41.25
Dividend Yield: 0.30%
Expense Ratio: 0.29%
Our next fund, the SoFi Social 50 ETF (NYSE:SFYF), provides exposure to the top 50 most widely held U.S. listed stocks in more than 100,000 separate self-directed brokerage accounts at SoFi Finance, part of the fintech group SoFi Technologies (NASDAQ:SOFI), which recently went public.
Stocks are rebalanced monthly and weighted according to how much money members have invested in each company at the end of every month.

SFYF has 50 holdings. The passively managed fund tracks the SoFi Social 50 Index and started trading in May 2019. The top 10 holdings make up slightly over 52% of total net assets, which stand at $16.55 million. In other words, it is a small fund.
The most important sectors (by weight) are consumer cyclical (35.8%), communications (22.1%), technology (20.3%), consumer non-cyclicals (13.0%) and industrials (3.8%).
Among the largest holdings are AMC, electric vehicle darlings Tesla (NASDAQ:TSLA) and Nio (NYSE:NIO), technology pioneer Apple (NASDAQ:AAPL) and GameStop.
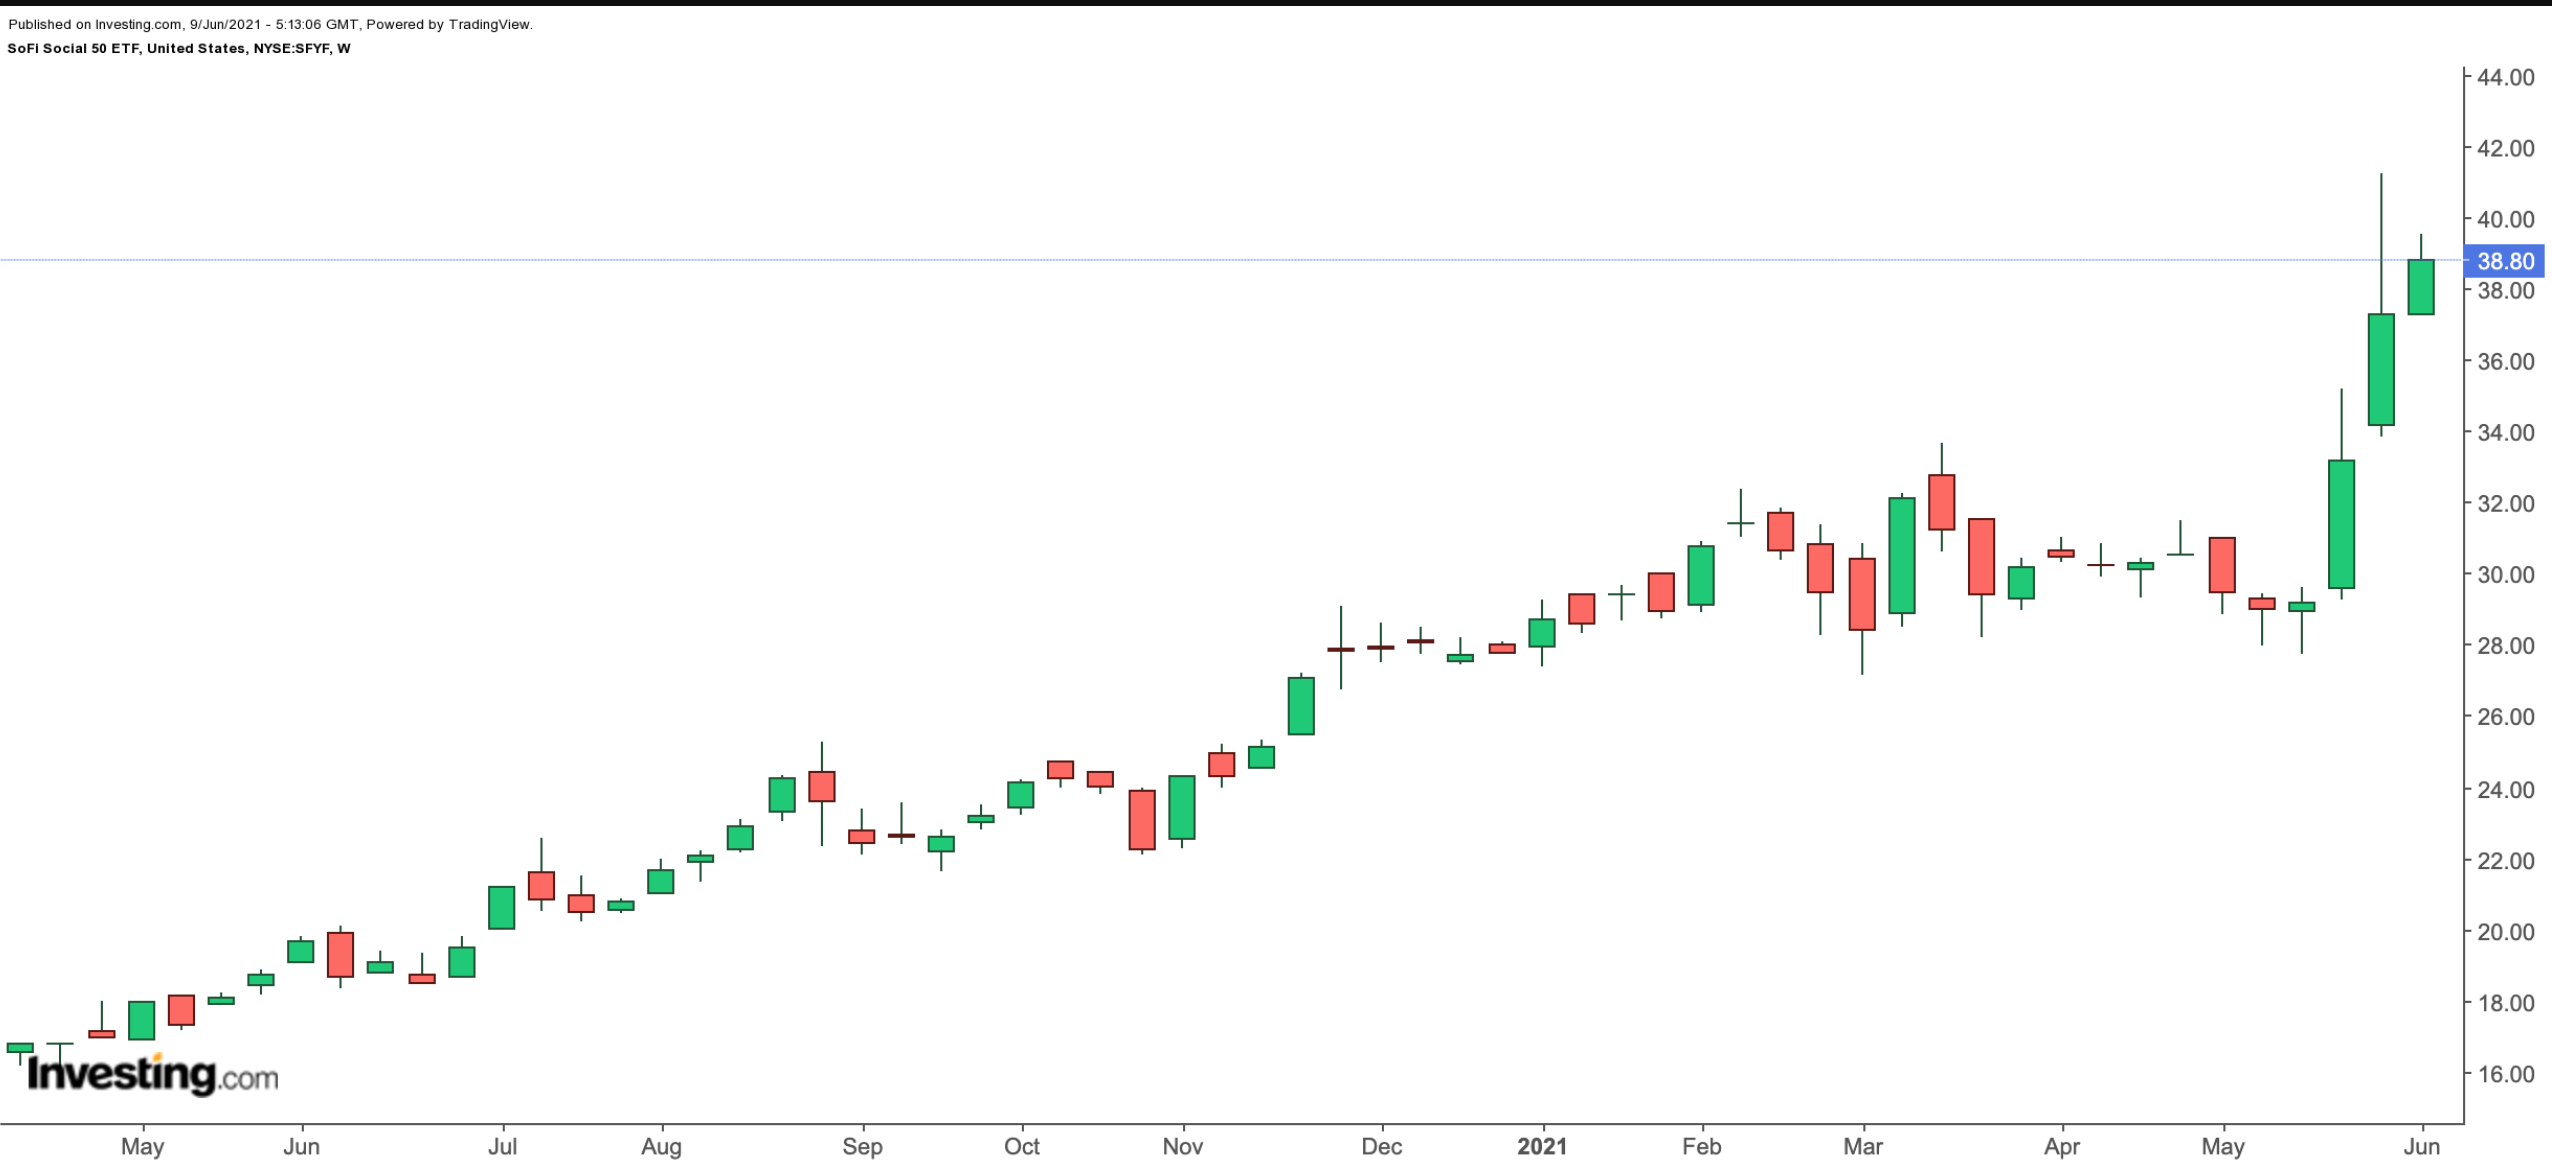
Year-to-date, the fund is up more than 43% and has returned close to 97% in the past 52 weeks. Potential investors could consider buying the dips in the fund.
