- Markets are bracing for a big jobs report today.
- We'll evaluate the S&P 500 and Nasdaq's technical position ahead of the critical data.
- The two indexes are trading just below a strong resistance zone.
- For less than $8 a month, InvestingPro's Fair Value tool helps you find which stocks to hold and which to dump at the click of a button.
The S&P 500 fell by 0.30% yesterday as concerns over the economy overshadowed any lingering bullish sentiments from before.
Meanwhile, Nasdaq edged up slightly by 0.25%, but futures for both indices indicate a cautious start to today’s session, with key economic reports on the horizon.
Yesterday, the ADP report indicated that the private payrolls increased by 99,000 in August, falling short of the 144,000 forecasts and marking the weakest performance since January 2021.
This miss, coupled with a slight decrease in initial unemployment claims, has heightened concerns about the economy’s health and fueled speculation of more aggressive Fed rate cuts. The Fed monitor tool now points to a 42% chance of a 50bp rate cut.
As traders await today's nonfarm payrolls report, let’s examine the technical positions of the S&P 500 and Nasdaq.
Nasdaq Faces Strong Resistance
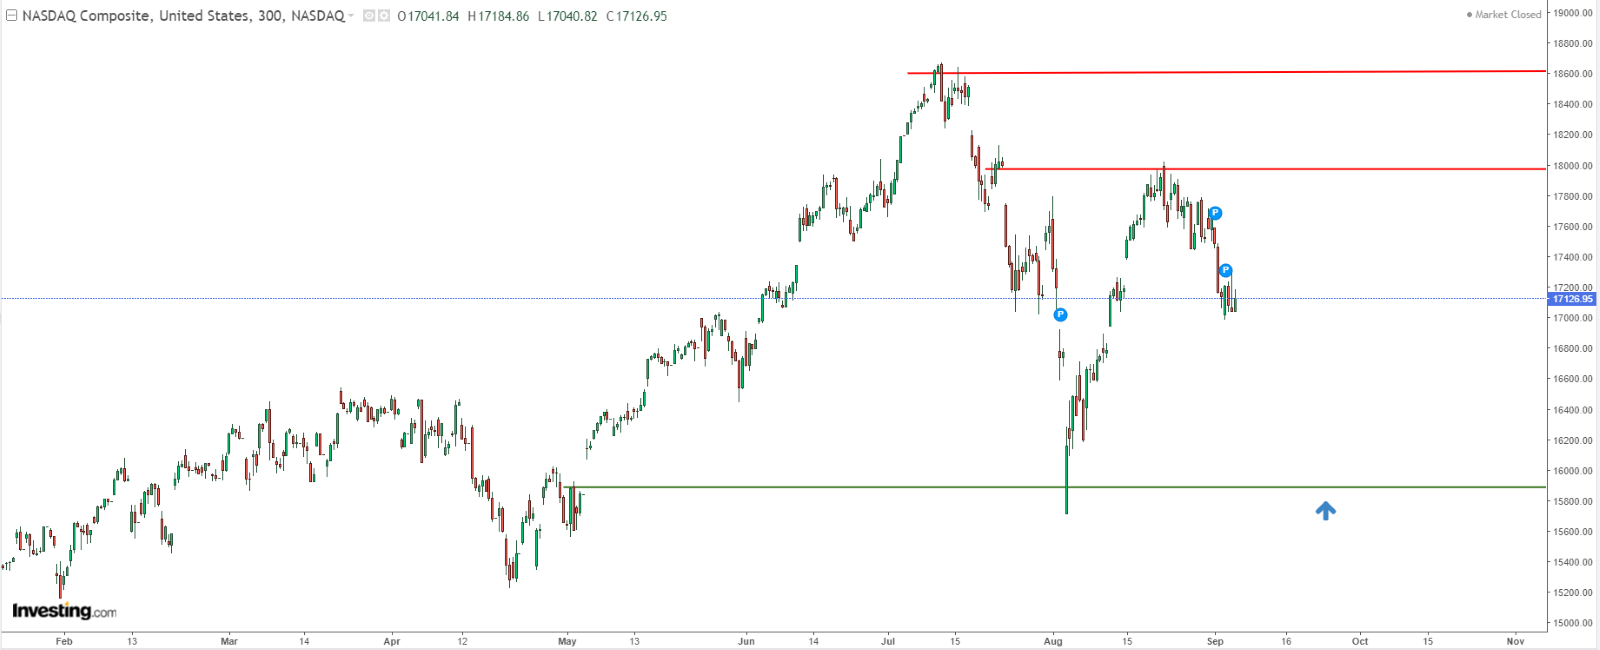
The Nasdaq has struggled to extend its gains, hitting resistance around the 18,000-point mark.

A noticeable price gap in this supply zone has halted the upward momentum. If the bears gain strength, the index might test lower levels near 15,700. Conversely, breaking through the supply zone could signal a reversal.
S&P 500 Shows Growing Weakness
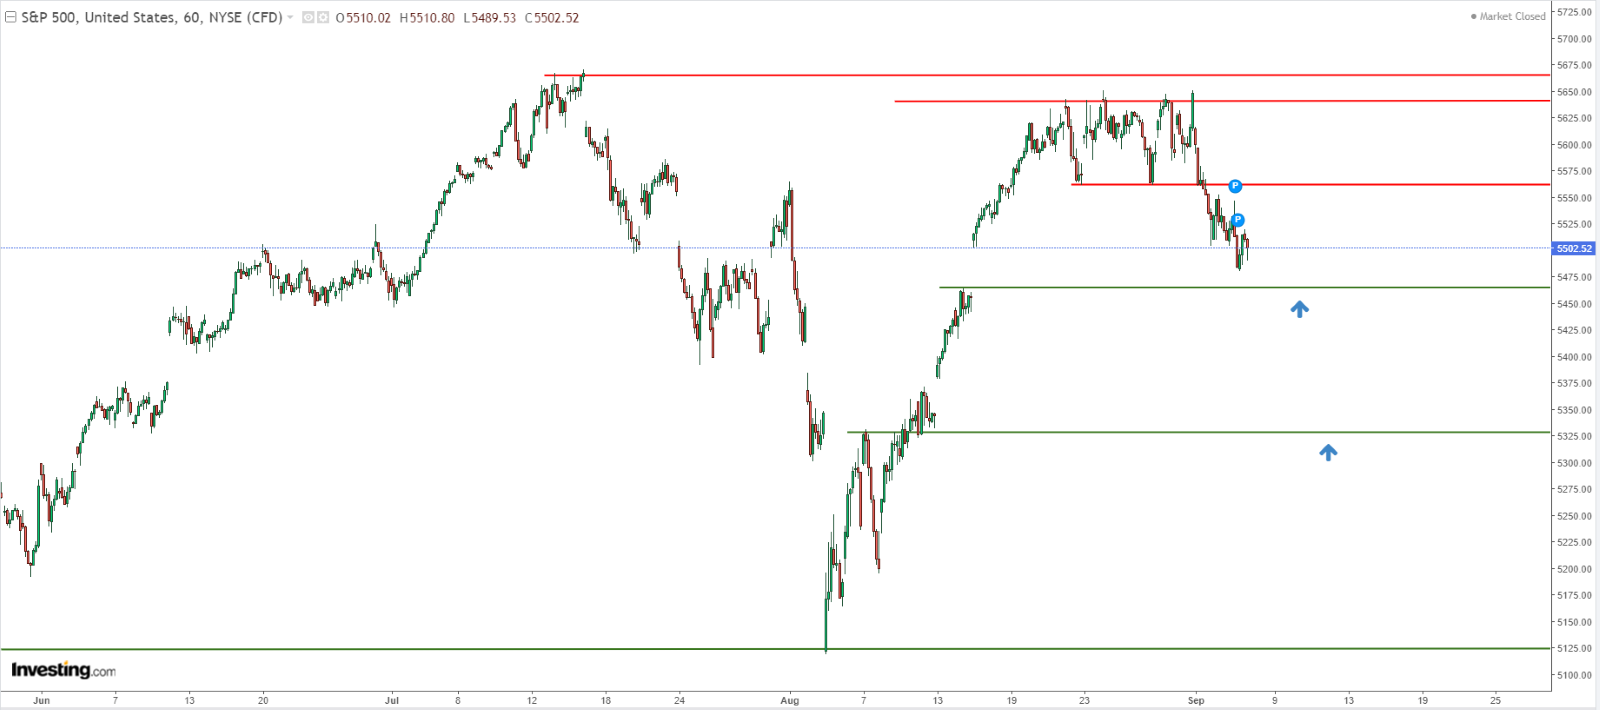
The S&P 500 was just short of setting new historical highs before experiencing a downward correction.

Bulls face a critical test to halt the decline around the 5,470 and 5,330 points, where local demand zones exist. A drop below 5,300 could signal a retest of strong support at 5,120 points.
DAX Lurks at All-Time Highs
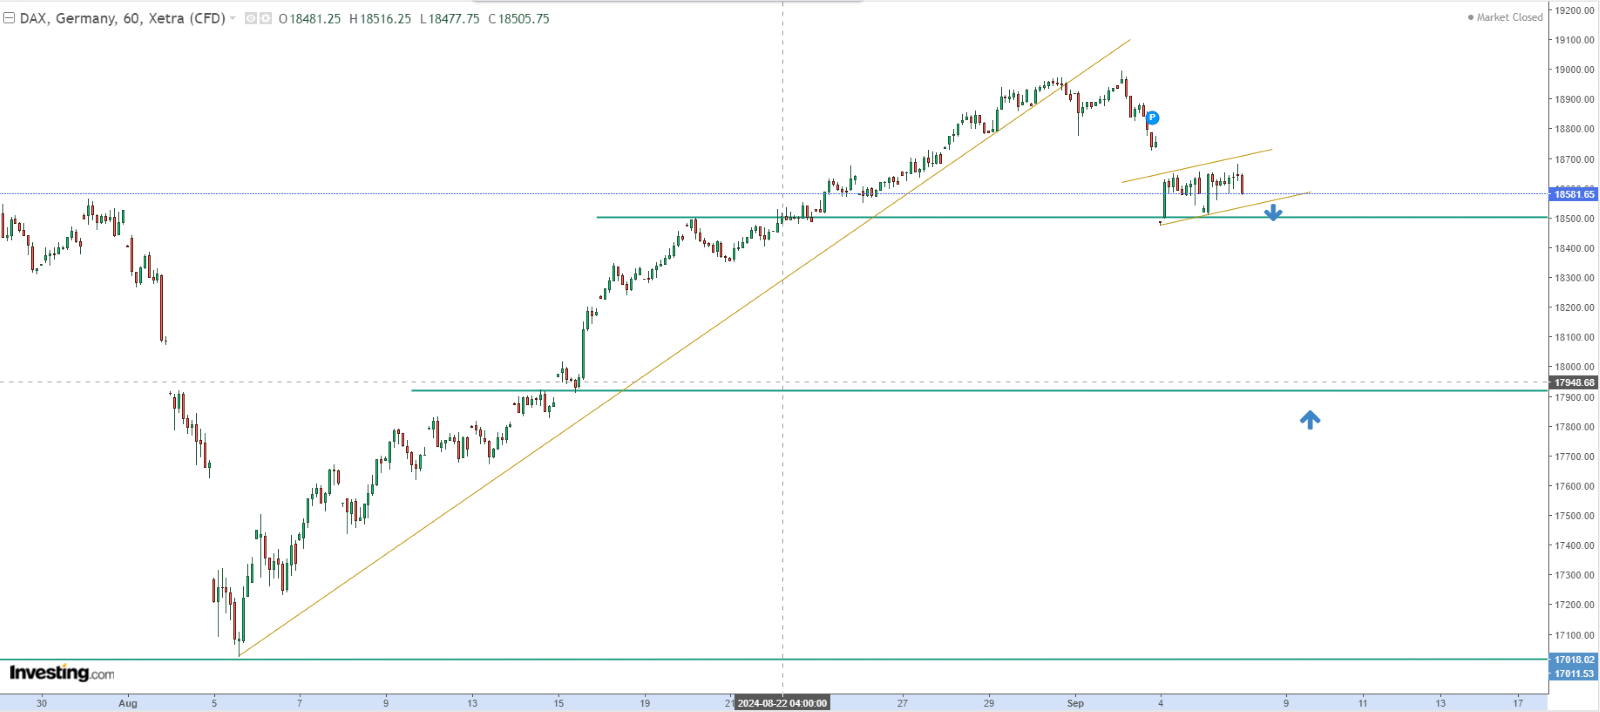
Among the major indices, the DAX stands out, having reached new historical highs in the ongoing bull market. It recently tested resistance around the 19,000-point mark.

Currently, the DAX is undergoing a corrective phase, slowing down near the local support level of 18,500 points. The formation of a flag pattern suggests a potential continuation of the decline.
If the index falls below this support level, it may open the path for further declines, targeting around 18,000 points.
***
Disclaimer: This article is written for informational purposes only; it does not constitute a solicitation, offer, advice, counsel or recommendation to invest as such it is not intended to incentivize the purchase of assets in any way. I would like to remind you that any type of asset, is evaluated from multiple perspectives and is highly risky and therefore, any investment decision and the associated risk remains with the investor.
