As economists and traders had widely expected, the Reserve Bank of Australia yesterday left the official cash rate unchanged at 2.00%. This was the fourth consecutive meeting that Stevens has chosen to sit on his hands rather than be one of the first to act following a month of uncertainty around China and global equities markets.
The accompanying Interest Rate Statement contained some small updates to the previous. In saying that however, overall sentiment was that rates will be left on hold for the foreseeable future with some chatter around that the next move will actually be up. Here are some key excerpts courtesy of LiveSquawk:
“AUD adjusting to significant declines in commodity prices.”
“Monetary Policy needs to be accommodative.”
“Further softening of conditions in China.”
“Economy likes to have spare capacity for some time.”
Heading into the rate decision, the Australian Current Account deficit blew out to $19 billion vs the expected $16 billion, putting massive pressure on today’s GDP number. The fall in commodities had to have an impact somewhere down the line and it would be no surprise to see GDP for the quarter turn negative (v expected 0.4%).
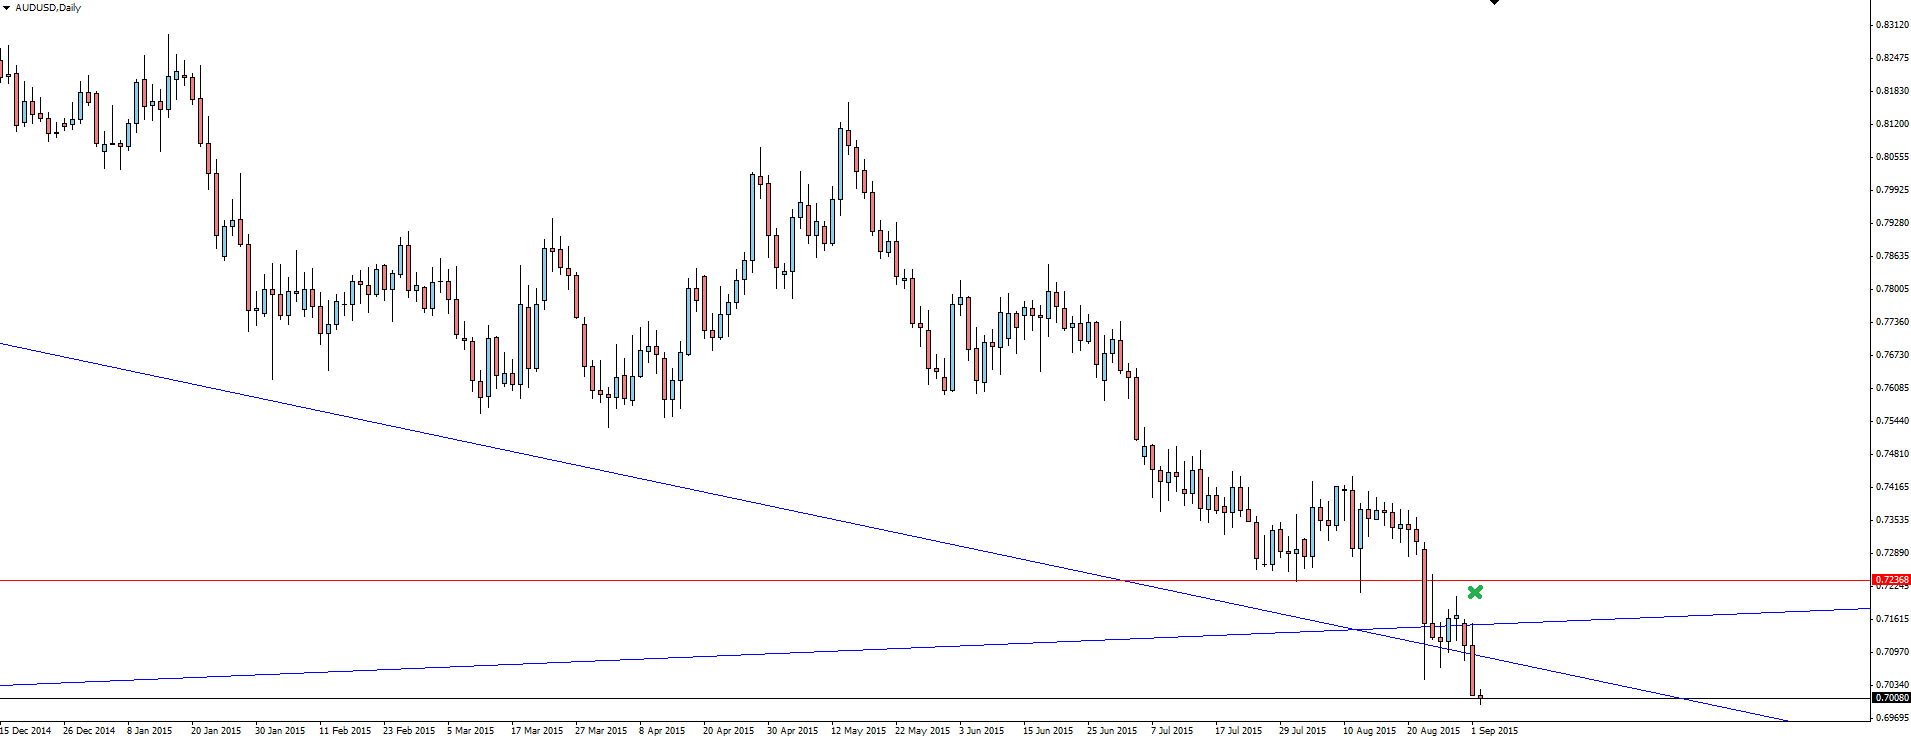
AUD/USD Daily:
We have been talking about the weekly trend line on AUD/USD and as you can see from the above daily chart, the level has now been broken no matter how you draw your trend line.
Yesterday also saw China’s official PMI data come in lower than previous months but still widely expected, doing nothing to improve the negative sentiment surrounding the Chinese economy and adding to the possible excuses that are piling up for the Fed to hold off on a September hike.
On the Calendar Wednesday:
AUD: GDP q/q
GBP: Construction PMI
USD" ADP Non-Farm Employment Change
Chart of the Day:
Indices Trading has a bit of a stigma around it when it comes to purely technical Forex traders because the charts can appear to contain gaps. If you take the time to work out your position sizing and market times then Indices actually present some of the cleanest technical setups around. Today we take a look at one such setup on the German DAX.
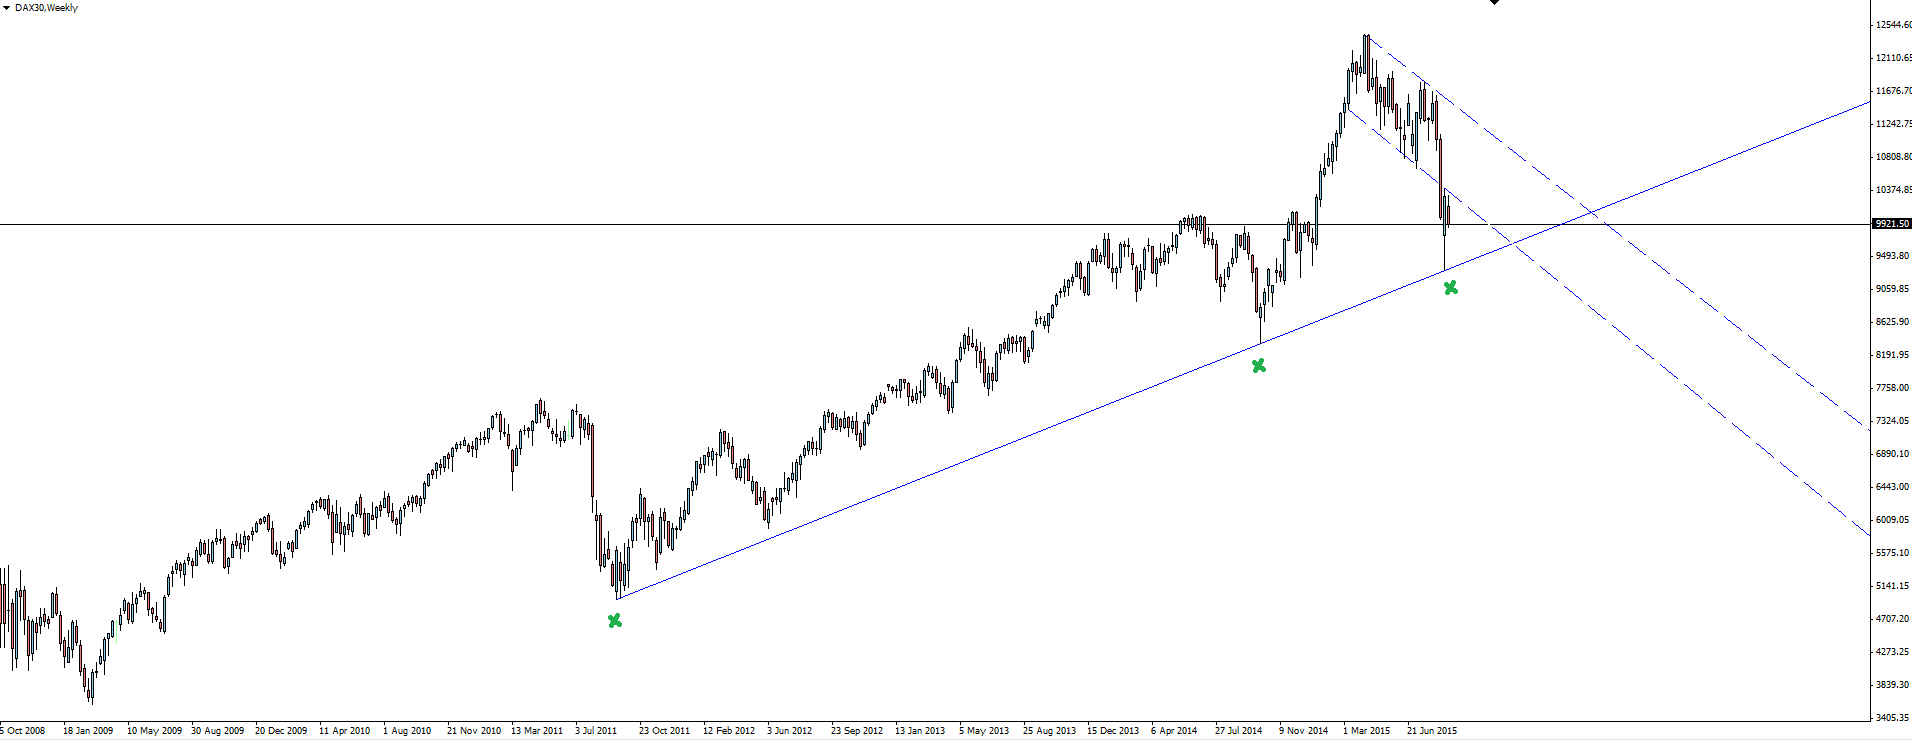
DAX30 Weekly:
The DAX 30 weekly chart shows a clean, bullish trend line that price has healthily pulled back to test for a third time after price got a little parabolic to begin the year.
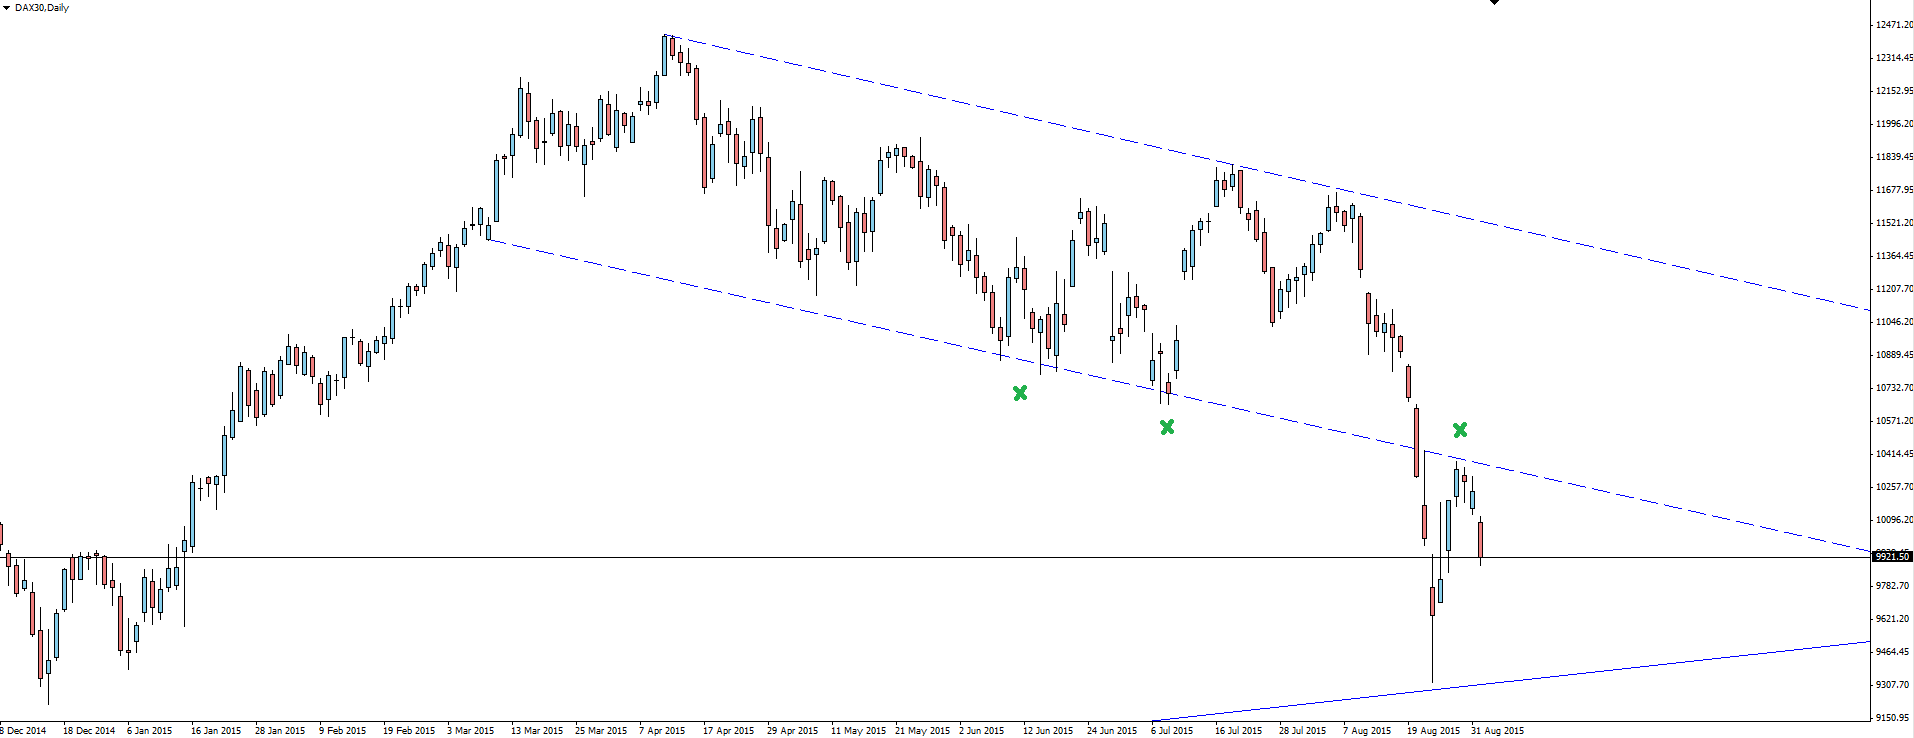
DAX 30 Daily:
It’s when we zoom into the daily chart that we see how clean the technical pattern actually is. Price formed a short term flag/channel pattern as it pulled back down to the trend line, with last week’s panic causing price to drop through the channel until support was found at the longer term level.
Price then pulled back and bounced again almost perfectly off the underside of the previous support level now being tested as resistance.
Risk Disclosure: In addition to the website disclaimer below, the material on this page prepared by Vantage FX Pty Ltd, does not contain a record of our trading prices, or an offer of, or solicitation for, a transaction in any financial instrument. The research contained in this report should not be construed as a solicitation to trade. All opinions, news, research, analyses, prices or other information is provided as general market commentary and marketing communication – not as investment advice. Consequently any person acting on it does so entirely at their own risk. The experts writers express their personal opinions and will not assume any responsibility whatsoever for the actions of the reader. We always aim for maximum accuracy and timeliness and Vantage FX shall not be liable for any loss or damage, consequential or otherwise, which may arise from the use or reliance on the service and its content, inaccurate information or typos. No representation is being made that any results discussed within the report will be achieved, and past performance is not indicative of future performance.
