Yes, we know that the headline may evoke some disparaging comments. Yes, we’re aware that there’s a global pandemic that's disrupting manufacturing lines and shipping supply chains, and we also know that planes are not taking off.
We also know that oil prices have crashed, despite pushing higher today after the Fed announced a set of aggressive measures to combat the economic hit of the coronavirus outbreak. Demand is shrinking along with global economies and the future for crude is looking seriously bleak.
But technical analysis can often help spot the patterns and trends we might miss if we focused purely on the fundamentals.
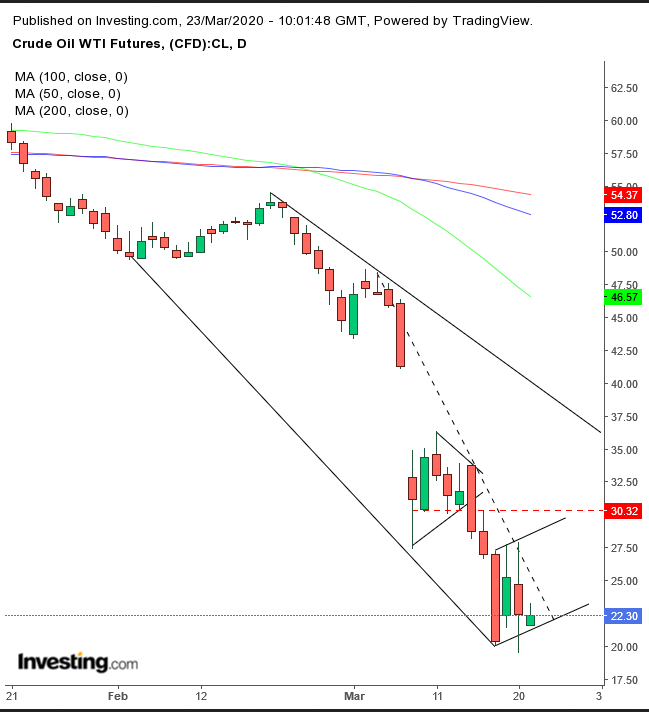
So, just as we forecast a 50% drop in oil prices back in August, a long time before anyone had even heard of the coronavirus, to a target of $26, based on our analysis of the charts at the time, we are now allowing for a return move to $30, based, once more, on the technicals.

The contract is trading according to a rising flag, bearish after the almost 40% free fall in just the three days between March 16 and 18. If prices resume this pattern, they would rise to the flag’s top.
At the same time, they would trade according to the pattern of a return-move that would follow the downside breakout of the preceding continuation pattern, the pennant, of March 9-16. Both patterns provide the momentum for price to return toward $30.
The mechanics and psychology of a continuation pattern, such as the pennant and flag, indicates that investors fear they got ahead of themselves—driving prices too far too fast; so they stop. They then exit positions, both to cash out and to see which way the wind blows next.
Meanwhile, new traders—miffed at the lost opportunity and hopeful of another such move—pick up the load that previous traders put down. This changing of hands is what causes the range.
If prices resume along the same trend, with the same motivators, once supply drowns out demand, sellers will be forced to lower their bid prices to find new, willing buyers, below the pattern — thus triggering the downside breakout.
The return-move is part of the dynamics, when bears cover shorts, causing an initial rise, attracting other traders who think prices will return to where they were before the preceding move. This adds to the demand, which is expected to be temporary, as shown above.
Trading Strategies
Conservative traders should wait for a downside breakout, followed by its own return move, which would retest the flag’s bottom side with prices closing lower after attempting to climb back into the flag.
Moderate traders may short if prices scale to the top of the current congestion.
Aggressive traders may risk a contrarian, long position, to the top of the flag.
Trade Sample
- Entry: $22
- Stop-Loss: $21
- Risk: $1
- Target: $27
- Reward: $5
- Risk:Reward Ratio: 1:5
