The 'new normal' in the days of COVID-19 means an increasing number of people are working-from-home, shopping online, learning virtually and even finding entertainment from the comfort of their own homes. Therefore, if there's just one thing that's become clear in 2020, it's that technology has become indispensable.
Although tech stocks were not immune from the selloff in February and March, most have made remarkable comebacks since hitting 52-week lows in late March. Many have shown resilience with strong second-quarter earnings that served to bolster share prices.
With that in mind, choosing which stocks are the most promising since so many are now at all-time highs can be complicated. Below, we'll address the benefits of investing in the tech as well as two ETFs that can provide a safer growth trajectory:
Why Tech?
Broadly speaking, tech businesses develop, manufacture or offer technology-based services or products. The sector encompasses a wide range of segments, from telecommunications to personal computers, semiconductors, e-commerce, software as a service, cloud computing, FinTech, online social networks, artificial intelligence, internet of things, robotics, big data and autonomous technology.
Many big tech names are listed on the NASDAQ Exchange and headquartered in Silicon Valley or Seattle. Giants like Alphabet (NASDAQ:GOOGL), (NASDAQ:GOOG), Apple (NASDAQ:AAPL) Facebook(NASDAQ:FB), Microsoft (NASDAQ:MSFT), and NVIDIA (NASDAQ:NVDA) among others have been leading the rally in tech shares.
Especially over the past decade, these household names have greatly influenced our lives. Despite the high cost of their stocks and short-term volatility, tech companies have offered stability and growth since institutions tend to invest in equities likely to see earnings growth quarter after quarter.
1. Defiance 5G Next Gen Connectivity ETF
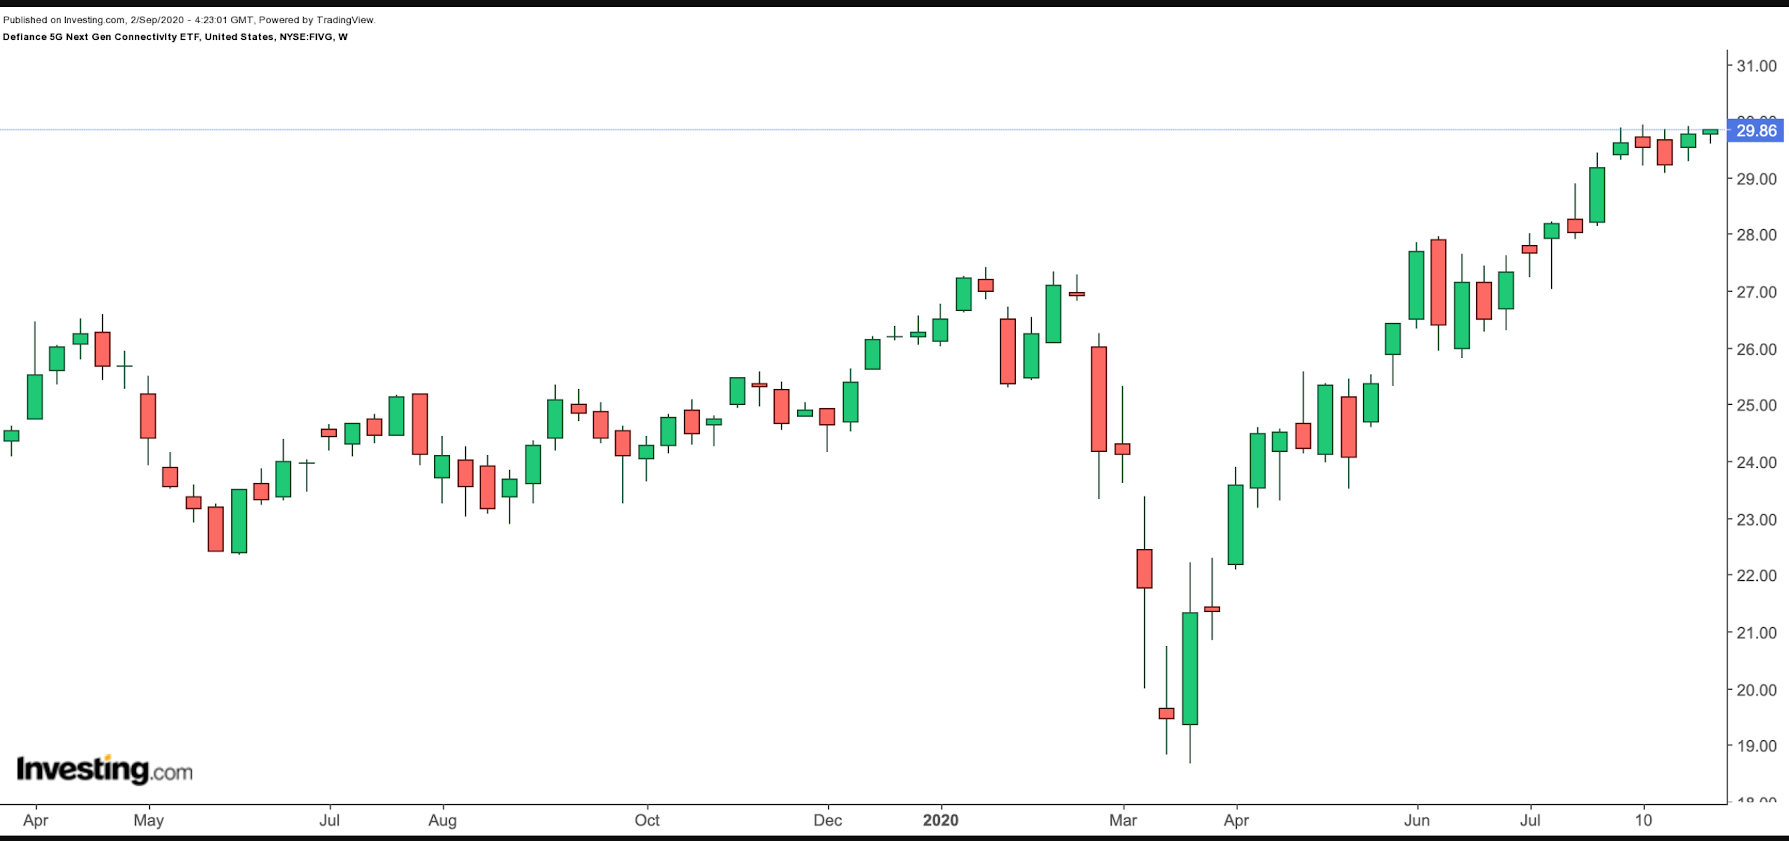
- Current Price: $29.86
- 52-Week Range: $18.66 - $29.92
- Expense Ratio: 0.30% per year, or $30 on a $10,000 investment
The Defiance 5G Next Gen Connectivity ETF (NYSE:FIVG), primarily offers exposure to companies engaged in the development or commercialization of systems used in 5G communications.

FIVG, which tracks the investment results of BlueStarGlobal 5G Communications index, includes 78 holdings. The three most important sectors (by weighting) are Radio Access Network Tech (37.58%), Mobile Network Operators, or MNOs, (15.77%) and Cell Tower & Data Center REIT (14.33).
The top ten holdings constitute close to 40% of FIVG's total net assets, which stand at $478 million. The fund's top five companies are Qualcomm (NASDAQ:QCOM), NXP Semiconductors (NASDAQ:NXPI), Ericsson (NASDAQ:ERIC), Analog Devices (NASDAQ:ADI) and Xilinx (NASDAQ:XLNX).
The world is getting ready for the 5G revolution, which will likely boost productivity and growth. This new technology will be at the center of the infrastructure and data economy that will be used to develop smart cities. It will also lower the lag or latency of mobile applications, which should have a positive impact on the development of online gaming as well as self-driving cars.
Year-to-date, the fund is up around 13%. In mid-August, it hit an all-time high of $29.92. The fund may come under pressure due to short-term profit-taking, which would offer better value for long-term investors. We'd consider buying around $27.5 or below.
2. ETFMG Prime Cyber Security ETF
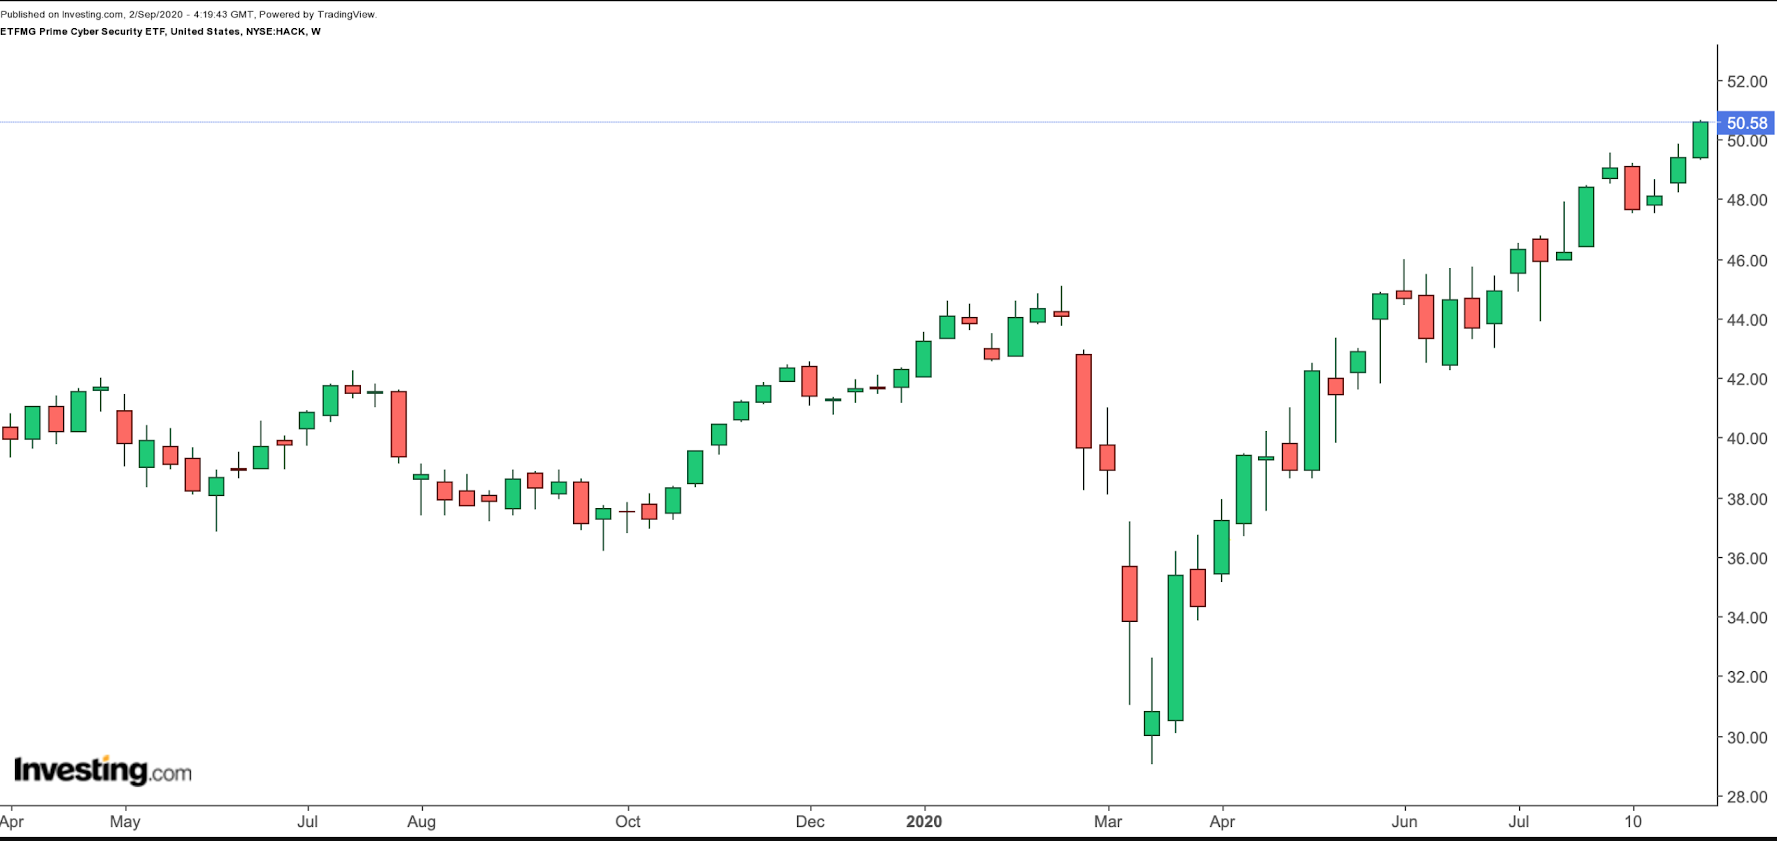
- Current Price: $50.58
- 52-Week Range: $29.02 - $50.63
- Expense Ratio: 0.60% per year, or $60 on a $10,000 investment
The ETFMG Prime Cyber Security ETF (NYSE:HACK) is a portfolio of companies providing cybersecurity solutions that include hardware, software, consulting and services to defend against cybercrime.

HACK, which tracks the Prime Cyber Defense Index, includes 57 holdings. The sector allocation (by weighting) is Systems Software (59.7%), IT Consulting & Other Services (10.6%), Communication Equipment (9.4%), Application Software (7.7%), Internet Services & Infrastructure (5.6%), Aerospace & Defense (5.4%) and Electronic Equipment & Instruments (0.8%).
The top ten holdings constitute over 30% of HACK's assets under management, which stands around $1.5 billion. The top five companies are Sailpoint Technologies (NYSE:SAIL), Cloudflare (NYSE:NET), Splunk (NASDAQ:SPLK), Cisco (NASDAQ:CSCO), and Liveramp (NYSE:RAMP).
Most analysts concur that the cybersecurity market is booming. As businesses and individuals need to keep digital data and their cyber environments safe, numerous upstarts and more established security firms have gained prominence.
So far in the year, HACK is up over 19%. It hit an all-time high on Aug. 27 and its price hovers at $50.5. Long-term investors researching cybersecurity stocks to buy may want to keep HACK on their radar. A potential pull-back toward the $47.5-level or below would mean a better entry point into the fund.
