Newton’s Law says what goes up, must come down. Those long oil don’t want to hear that, of course.
Like the proverbial multi-lived cat, the rally in crude oil has outlasted one fatal test after another.

The far from desirable pace of the COVID-19 vaccine rollouts and the fragility of the US recovery from the pandemic are two examples of cautionary developments that have not bothered oil bulls one bit.
What’s notable is the indifference shown by the long-oil community to the anemic demand for gasoline, jet fuel and heavy fuel oils as the world continues to take fewer drives, flights and cruises, respectively, compared to a year ago.
This same group instead points to the weekly drawdowns in US crude seen since the end of January. The declines in crude inventories are occurring as refiners max out fuel products in anticipation of more demand in the coming months based on the immunization targets of the Biden administration and other governments.
Except for China—and to an extent, India—the rest of the world, especially the United States, is seeing more implied demand from refiners than demand ultimately from end-users of fuels. Yet, prices of both crude and fuel products like gasoline are trading at pre-pandemic highs.
This isn’t to say oil traders have completely ignored all the negatives in the market.
Last Friday, benchmark prices fell their most in a single day since mid-January, with US West Texas Intermediate crude losing 2% and London’s Brent 1.6%, on worries that the Arctic blast that disrupted production in Texas could extend to refinery outages that pile up crude stocks.

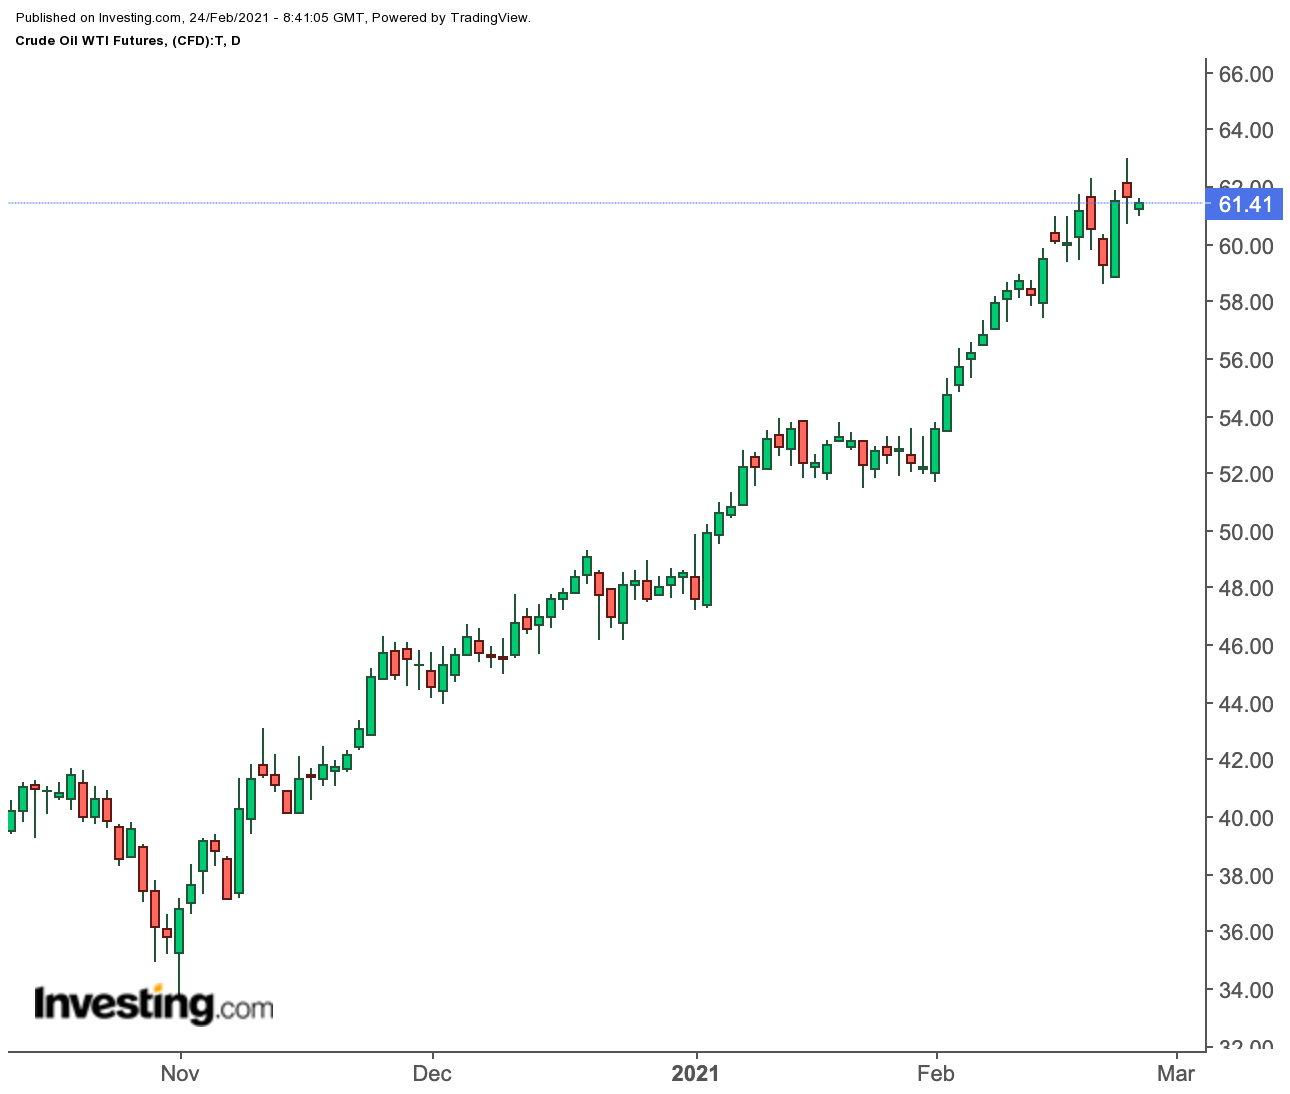
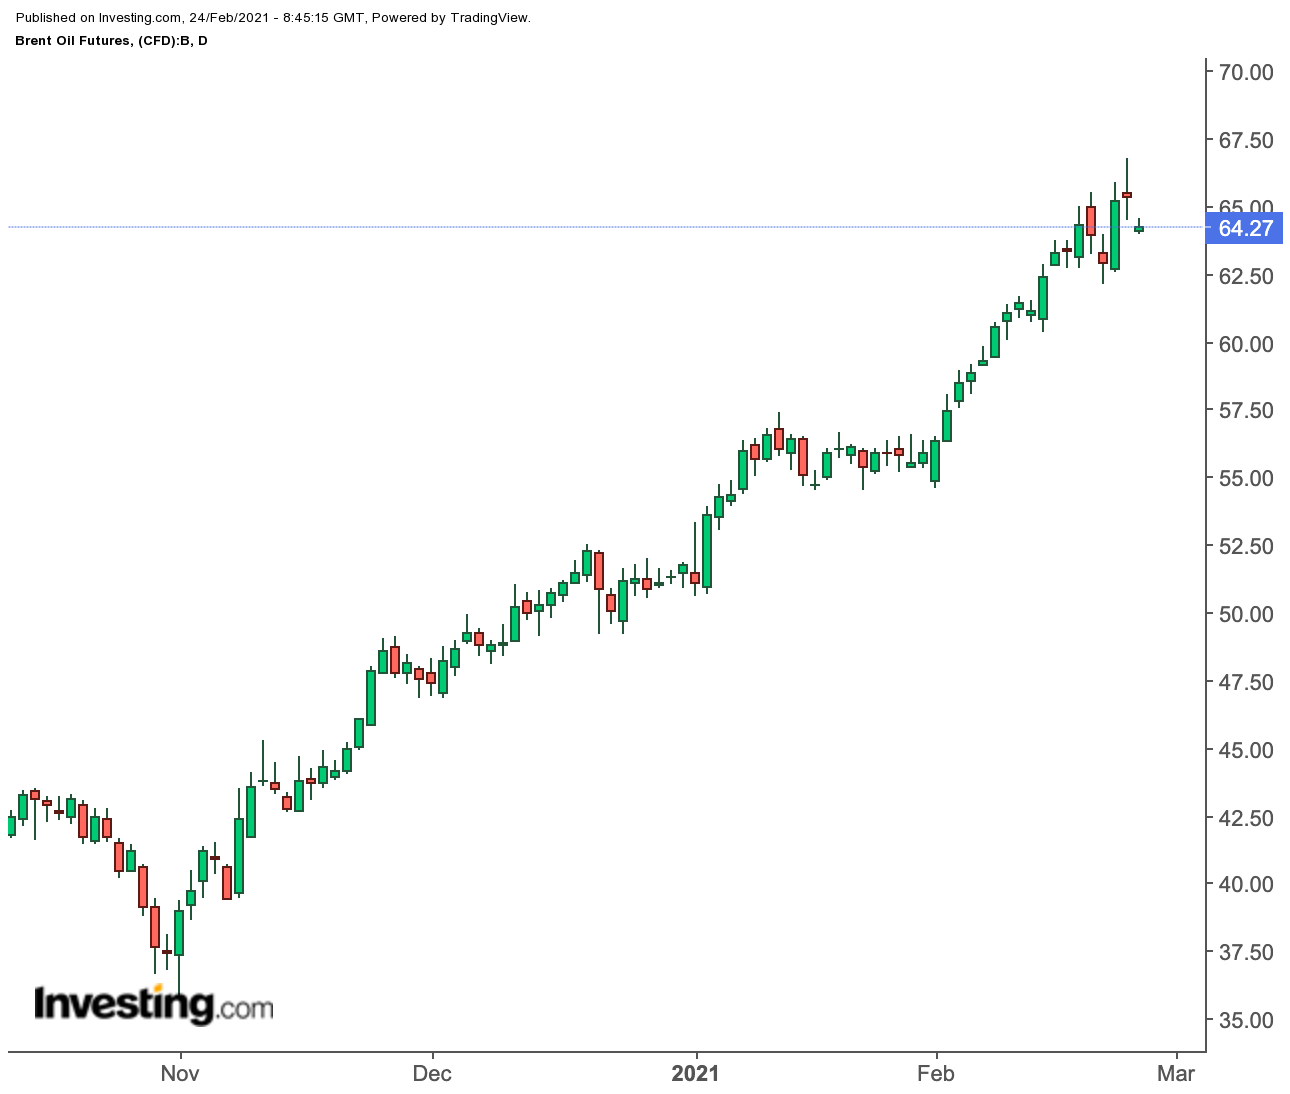
But such price declines are few and far between the otherwise humongous gains that have bloated the value of WTI and Brent by at least 70% since the end of October.
Each Slide Followed By Even Higher Rally
Often, any considerable slide in prices is offset by an even greater rally in the subsequent session or two. Friday’s selloff, for instance, was eclipsed by Monday’s 4% jump in WTI on optimism over Biden’s proposed $1.9 trillion coronavirus relief bill.
In fact, it’s expectations over this stimulus, combined with the bond-buying bonanza and near-zero interest rates of the Federal Reserve since the start of the pandemic, that has created a flood of cheap money in the markets. The result has been an overpowering rally in equities to commodities of almost all kinds, from buying generated by investors of all types, from day-traders to hedge funds and institutional money managers.
Since this gravy train is what has been keeping the commodities rally chugging, it’s likely that its run might also hit a bump when the flow of money to the markets reaches some sort of a temporal peak set in the minds of investors.
In practical terms, a correction in oil might be triggered once the window for Biden’s stimulus closes with its passage through Congress. Or worse, if the bill falters for some reason in the Senate, where Democrats backing the president have an effective majority of just one. Until then, it might be safe to assume that no meaningful or prolonged selloff in oil will happen.
Biden has been laser-focused on the stimulus bill, making it the number one agenda item of his first 100 days in office, aside from immunizing as many Americans as possible. And the cheerleaders in both commodities and on Wall Street—notwithstanding the NASDAQ-led selloff of the past two days—have thrown their lot in with the president.
Mid-March Target For Stimulus Might Be Cue For Oil
Senate Majority Leader Chuck Schumer has set Mar. 14 as his target for Biden’s COVID-19 bill to be signed into law. That might also be the target for the oil rally to reach a temporal peak, and for an appreciable retreat to set in.
Of course, none of this is cast in stone, and energy prices could go either way over the next three weeks. Bank of America Merrill Lynch sees Brent up as high as $70 by the end of the first quarter. Goldman Sachs, meanwhile, thinks the global crude benchmark will reach $75 by the third quarter.
Potential crude stockpile builds over the next week or two might weigh on oil prices, especially if refineries in Texas take longer than expected to rebound from the worst snowstorm in three decades to hit the heartland of US energy.
There’s also the other big question on what the US and Iran could achieve over the next few weeks in negotiations for Tehran to once again export its oil to the world without Trump-era sanctions.
Of course, the big “if” for this will be whether the Islamic Republic will first meet Biden’s demand to stop all uranium-enrichment—i.e. nuclear-bomb making—efforts to be considered for a deal by the White House.
At its peak, Iran produced as much as 4.0 million barrels per day and exported about half of that before the 2018 sanctions imposed by Trump.
But many, including Goldman Sachs, are playing down the potential impact of Iran’s return to the export market for oil. In a note issued at the weekend, the Wall Street bank said:
“In particular, the recovery of Iranian exports is likely to take months and would further be accommodated within our assumed aggressive ramp-up in OPEC+ output this summer.“
“This increases our conviction in a tight oil market this summer, when we expect OECD inventories to normalize,” it added, referring to stockpiles in the world’s most developed countries.
Adding To Worries: New OPEC+ Deal; What $65 Oil Could Do For US Shale
The OPEC+ output referenced by Goldman Sachs circles back to the observations made earlier this week by my colleague Geoffrey Smith on the seemingly endless oil rally.
That article notes that Russia is already pushing for a big increase in output at next week’s monthly review of the production pact of the enlarged Organization of the Petroleum Exporting Countries, known as OPEC+, which Moscow is a leading ally of.
When the bloc meets in April to set new output levels, its leader Saudi Arabia will inevitably want to reverse a unilateral cut of 1 million barrels a day that the kingdom enacted to preserve a unity that was already cracking a month ago.
For context, Saudi Arabia and Russia have been able to keep their rivalry under control and have stuck to their pledged output cuts. In all, OPEC+ is still withholding over 6 million barrels a day of oil production capacity in reserve. As a result, world stockpiles, which hit record levels as demand plummeted last summer, are due to be back at their five-year average by the middle of the year, according to the International Energy Agency’s latest monthly report.
OPEC+ increases could spur US shale drillers to raise for the first time in a year their production, which has been on the wane since hitting a record high of 13.1 million bpd in March 2020. While shale drillers are still in cash conservation mode, the sight of both WTI and Brent trading at near $65 would definitely be an encouragement to add barrels, Smith noted.
Should oil enter a selloff phase, how low could it go technically?
Sunil Kumar Dixit of SK Dixit Charting in Kolkata, India, gives some clues, pegging WTI to as low of $51.60 and Brent at $58.30, saying both have been technically overextended for months.
Adds Dixit:
“A break below WTI’s Feb. 19 low of $58.57 will coincides with its daily chart’s middle Bollinger Band and 20-Day Simple Moving Average.
“This will be followed by the Feb. 12 low of $57.39, which is very likely to trigger a chain of correctional cycle, pushing WTI to a 10-week Exponential Moving Average (EMA) of $55.10 and the 50 Day EMA of $54.77. The sell off can extend to the horizontal support area $53.77 - $51.60.”
On Brent, he said weakness signs start “with a break down below $62.30 to retest further below the 200 week Simple Moving Average of $58.30”.
Disclaimer: Barani Krishnan uses a range of views outside his own to bring diversity to his analysis of any market. As an analyst for Investing.com he presents divergent views and market variables.
Comments are welcome and encouraged. Inappropriate comments will be reported and removed.
