Baidu Inc (NASDAQ:BIDU) CEO Robin Li Yanhong suggested back in March that the trade war with the U.S. has no meaningful impact on the Chinese internet search provider.
Seven weeks later, on May 17, the stock plunged 16.5 percent, despite having shown solid, 21% growth in revenuein the first quarter. Investors sold it off specifically because of the trade war. Baidu makes its revenue from advertising and March marked a full year since the start of the trade spat, prompting the company’s clients to cut back on advertising.
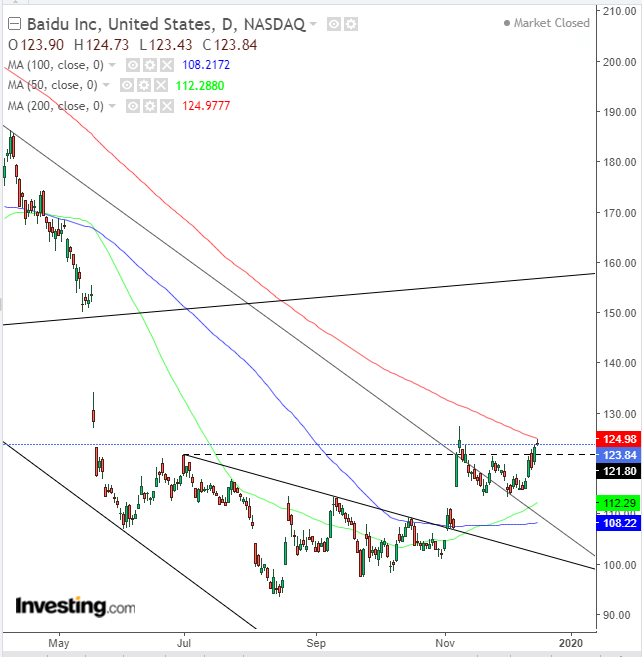
On Monday we featured Caterpillar Inc's (NYSE:CAT), our favorite among the 25 companies listed on CNBC’s China Trade Index. We believe Baidu had the biggest upside potential among that group, though earlier in the week we wanted more evidence the stock had bottomed. The chart below helps provide additional clarity on where the company's shares are headed.

The 16.5% plunge on May 17 created a falling breakaway gap, as it dropped below the long-term uptrend line since January 2009. After that fateful day, investors deepened the plunge by another 26%, till the Aug. 15, $93.39 bottom. A $58.96 plunge from the closing price on May 16 of $153.70. All told, the price was slashed by 38.46%.
However, the company has been steadily climbing since, rising $30.04, or 32.17%. Has it bottomed? Not just yet, but it could be close.
The stock has been struggling to break free of a falling channel since mid-May 2018. The 200 DMA has been tracing the channel top and is now providing resistance, turning yesterday’s candle into a doji, below the Nov. 7 highs. It's threatening a fall back below the July 1 high, above which the price has been unable to break free since then.
The 50 DMA has been rising toward the 200 DMA, toward a possible golden cross, on positive trade sentiment. Investors are likely to wait to see which way the wind blows in the back-and-forth trade talks and whether they might lead to an actual agreement between the world’s two mightiest economies. A close above $130 would suggest that the way is paved till the next major resistance, the $160 area — the congestion before the fall.
Trading Strategies
Conservative traders should wait before entering a long position for a close above $135, with a return move that demonstrates support above the November-December range.
Moderate traders might be content with a close above $130 and a pull back for a better entry, not proof of demand.
Aggressive traders may enter a contrarian trade, relying on the quadruple resistance: July 1 high, Nov. 8 high, the 200 DMA and the doji. The proximity to resistance provides an attractive risk-reward ratio.
Trade Sample
