This article was written exclusively for Investing.com
Admittedly, there isn’t an awful lot to look forward to today in terms of economic data, except a few macro pointers from North America. Investors are busy digesting company earnings and what their results mean for the wider markets. For FX traders, the USD/CAD might be the one to watch for some volatility given that we have Canadian wholesale sales coming up later, as well as US building permits, housing starts and UoM consumer sentiment.
It remains to be seen whether and how much the USD/CAD will respond to the above data, given that this pair has become increasingly sensitive to the “risk on, risk off” trade, whereby it reacts negatively to the volatility in the equity markets. So, a lot depends on the direction of the stock markets and, judging by overnight price action in index futures, and European indices such as the FTSE and DAX (both higher when this report was written), Wall Street may end the week on a positive note. That should be good news for the Canadian dollar and bad for the USD/CAD.
On Thursday, the USD/CAD rebounded as the buyers stepped in to support the 200-day moving average again. The US dollar was supported by forecast-beating retail sales and Philly Fed Index, with the greenback finding additional buying interest thanks to mild haven flows after the major equity indices retreated.
But if sentiment towards risky assets continue to remain positive, then the USD/CAD could move back down, and this time potentially break decisively lower. Otherwise, the wait will have to continue for the bears until at least next week, when we will have some important Canadian data including retail sales (Tuesday) and CPI (Wednesday).

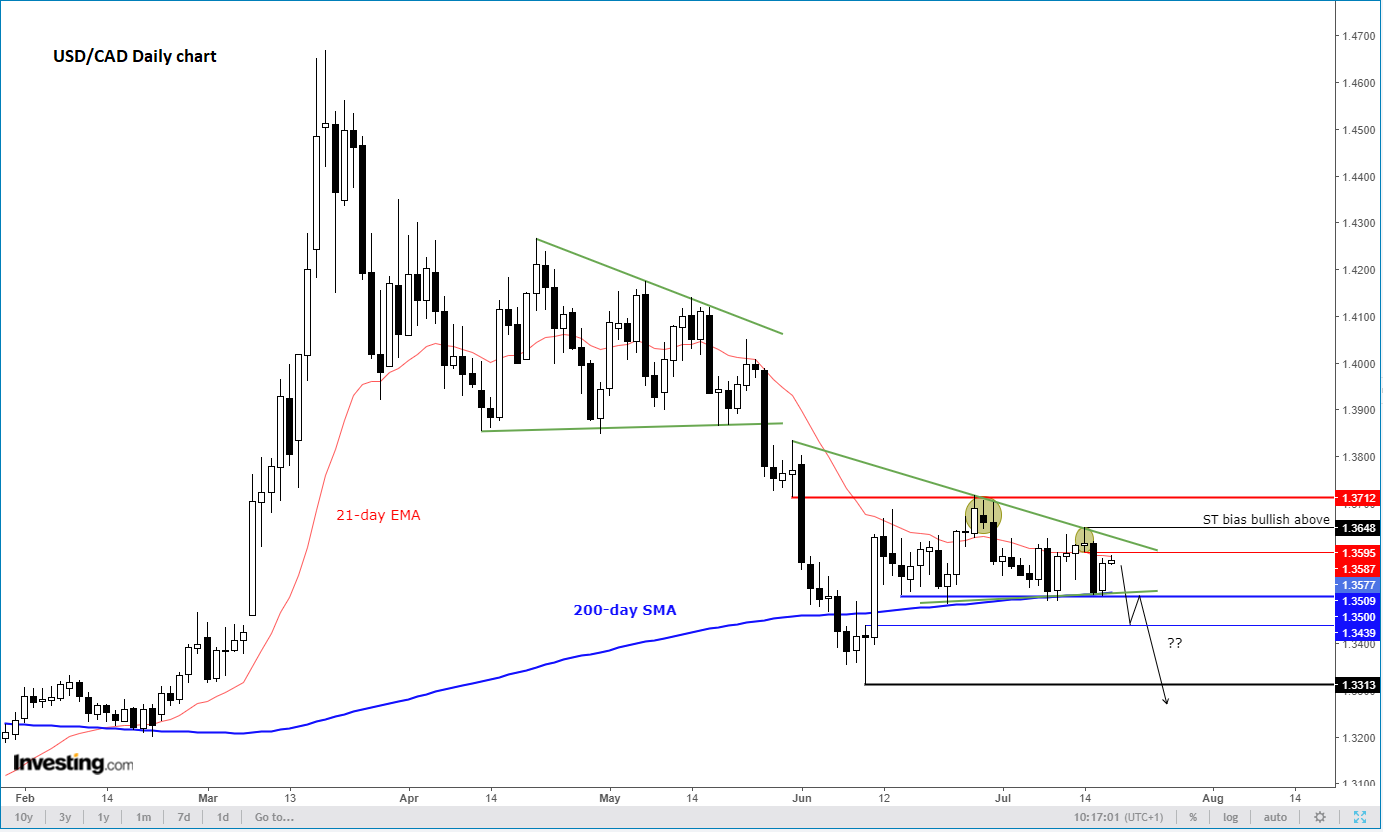
From a technical point of view, the USD/CAD has been printing lower lows and lower highs in recent weeks, clearly highlighting the fact that the trend is bearish. More recently, it has been consolidating inside a pennant formation, with the sellers unable thus far to break the 200-day average. A similar consolidation pattern had been established between April and May, before rates broke down decisively at the end of May. Could we see a similar breakdown again?
So, what I want to see next from a bearish point of view, either today or over the next few trading sessions, is a decisive break below support and the 200-day average around 1.3510. Should that happen then the USD/CAD could drop to a new multi-month low below 1.3310, where trapped buyers’ stop loss orders may be resting.
However, if the bearish scenario does not play out and we move north of this week’s earlier high at just shy of 1.3650 then this would invalidate the short-term bearish view, potentially leading to a sharp squeeze higher – especially if there is a corresponding sell-off for stocks (and/or crude oil).
